Long-Range Outlook
Snow in the Next 72 Hours
The official National Weather Service snowfall forecast for the lower 48, added up over the next three days. Refreshed every hour.
Expected SnowfallSource: NOAA WPC ↗
Map temporarily unavailable. View on NOAA
The dates at the top show the exact window. At a few hours of the day NOAA's longest total covers 66 hours instead of 72. For a closer look, or the odds of bigger totals, open NOAA's interactive version. Your resort's own forecast page has the numbers for your mountain.
Next 3 Days
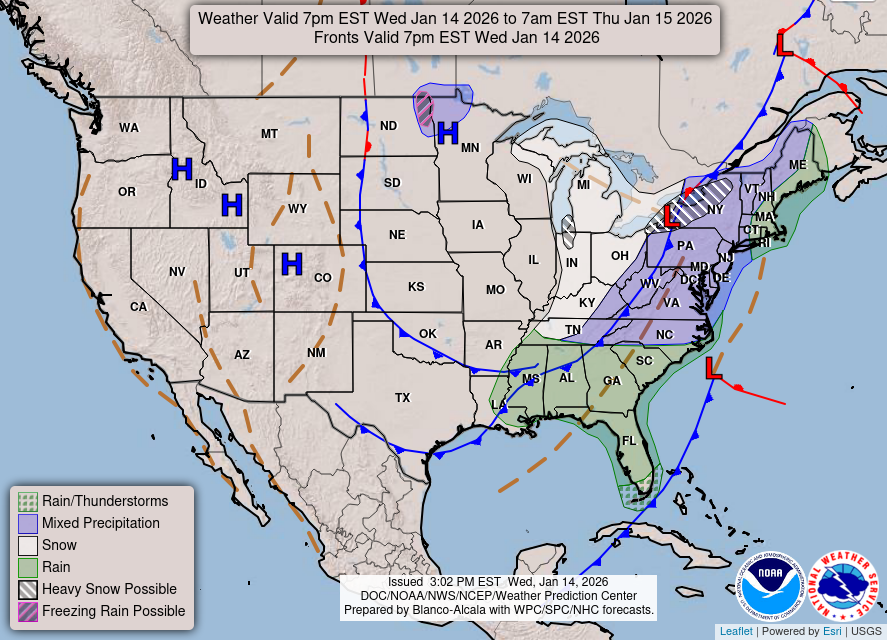
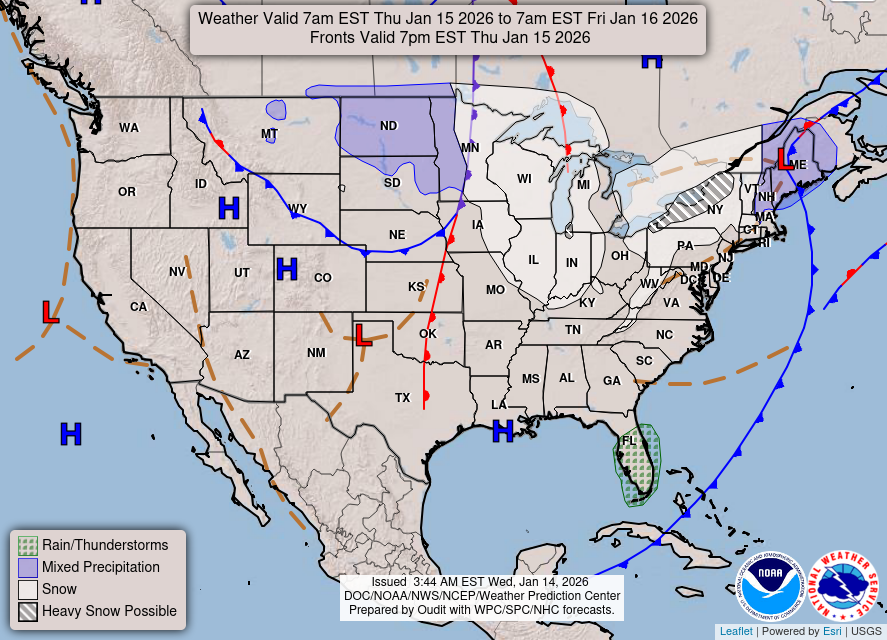
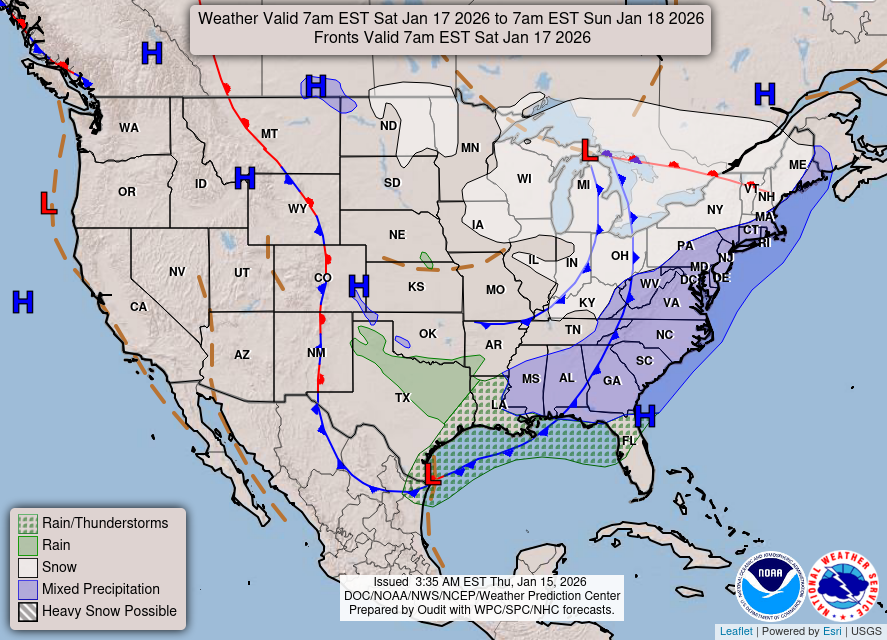
The map forecasters use: fronts, highs and lows, and where rain and snow are expected. From NOAA's Weather Prediction Center, updated through the day.
National ForecastSource: NOAA WPC ↗
Map temporarily unavailable. View on NOAA
Map temporarily unavailable. View on NOAA
Map temporarily unavailable. View on NOAA
Each map covers 24 hours from 8 am Eastern; the exact window is printed at the top of the map. Hatched areas mark where NOAA sees a risk of heavy snow, severe storms or flooding.
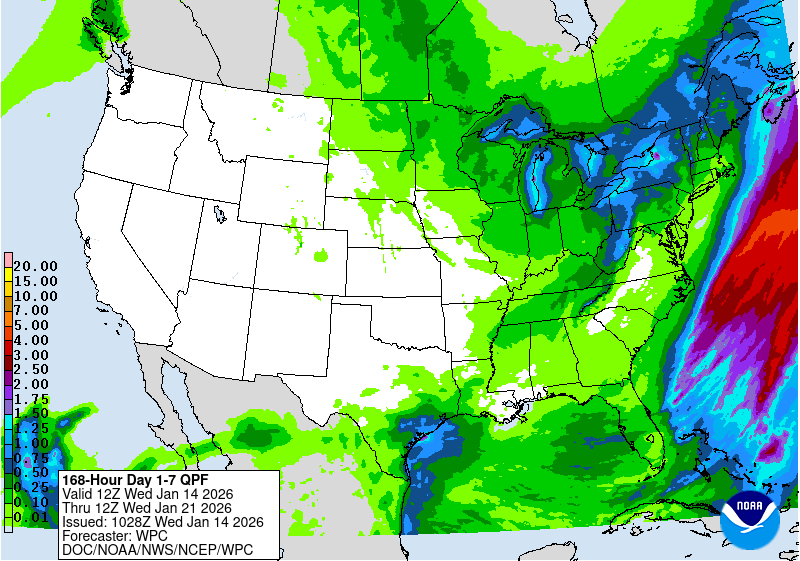
Rain and Snow Water, Next 7 Days
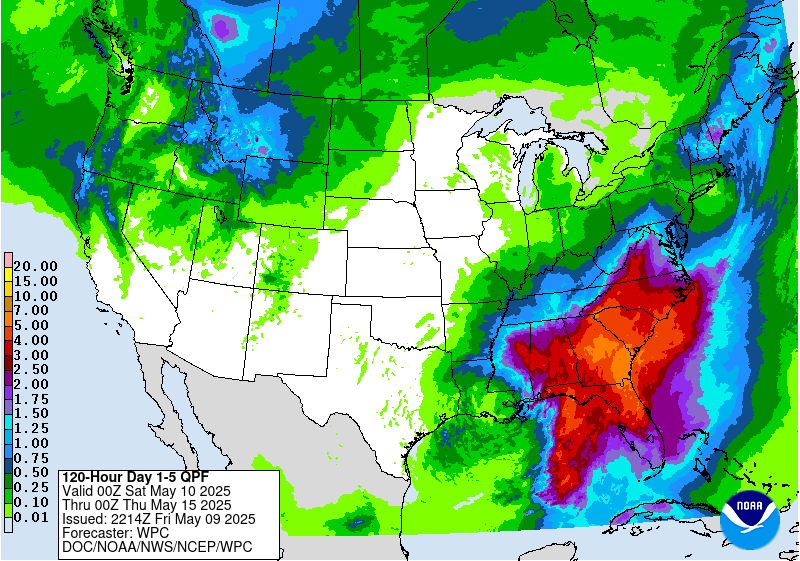
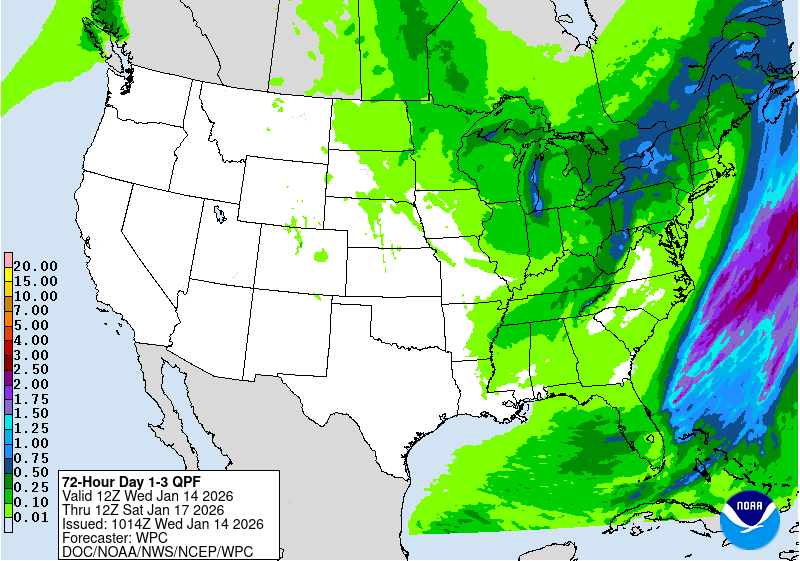
How much water falls as rain and snow combined, measured melted, from NOAA's Weather Prediction Center. When it's cold enough to snow, an inch of water usually means about 10 inches of snow, and more in cold, dry storms.
Total PrecipitationSource: NOAA WPC ↗
Map temporarily unavailable. View on NOAA
Map temporarily unavailable. View on NOAA
Map temporarily unavailable. View on NOAA
Amounts are inches of water. The window and the time NOAA issued the map are printed in the box at the bottom left. The map covers the lower 48 and the edge of southern Canada. Your resort's own forecast page has the snow numbers for your mountain.
Live Radar
The whole country, looping the last 50 minutes. Pinch or scroll to zoom in on a storm, a hurricane coming ashore, or your mountain.
Loading radar…
Radar: NOAA NEXRAD via Iowa Environmental Mesonet · radar.weather.gov ↗
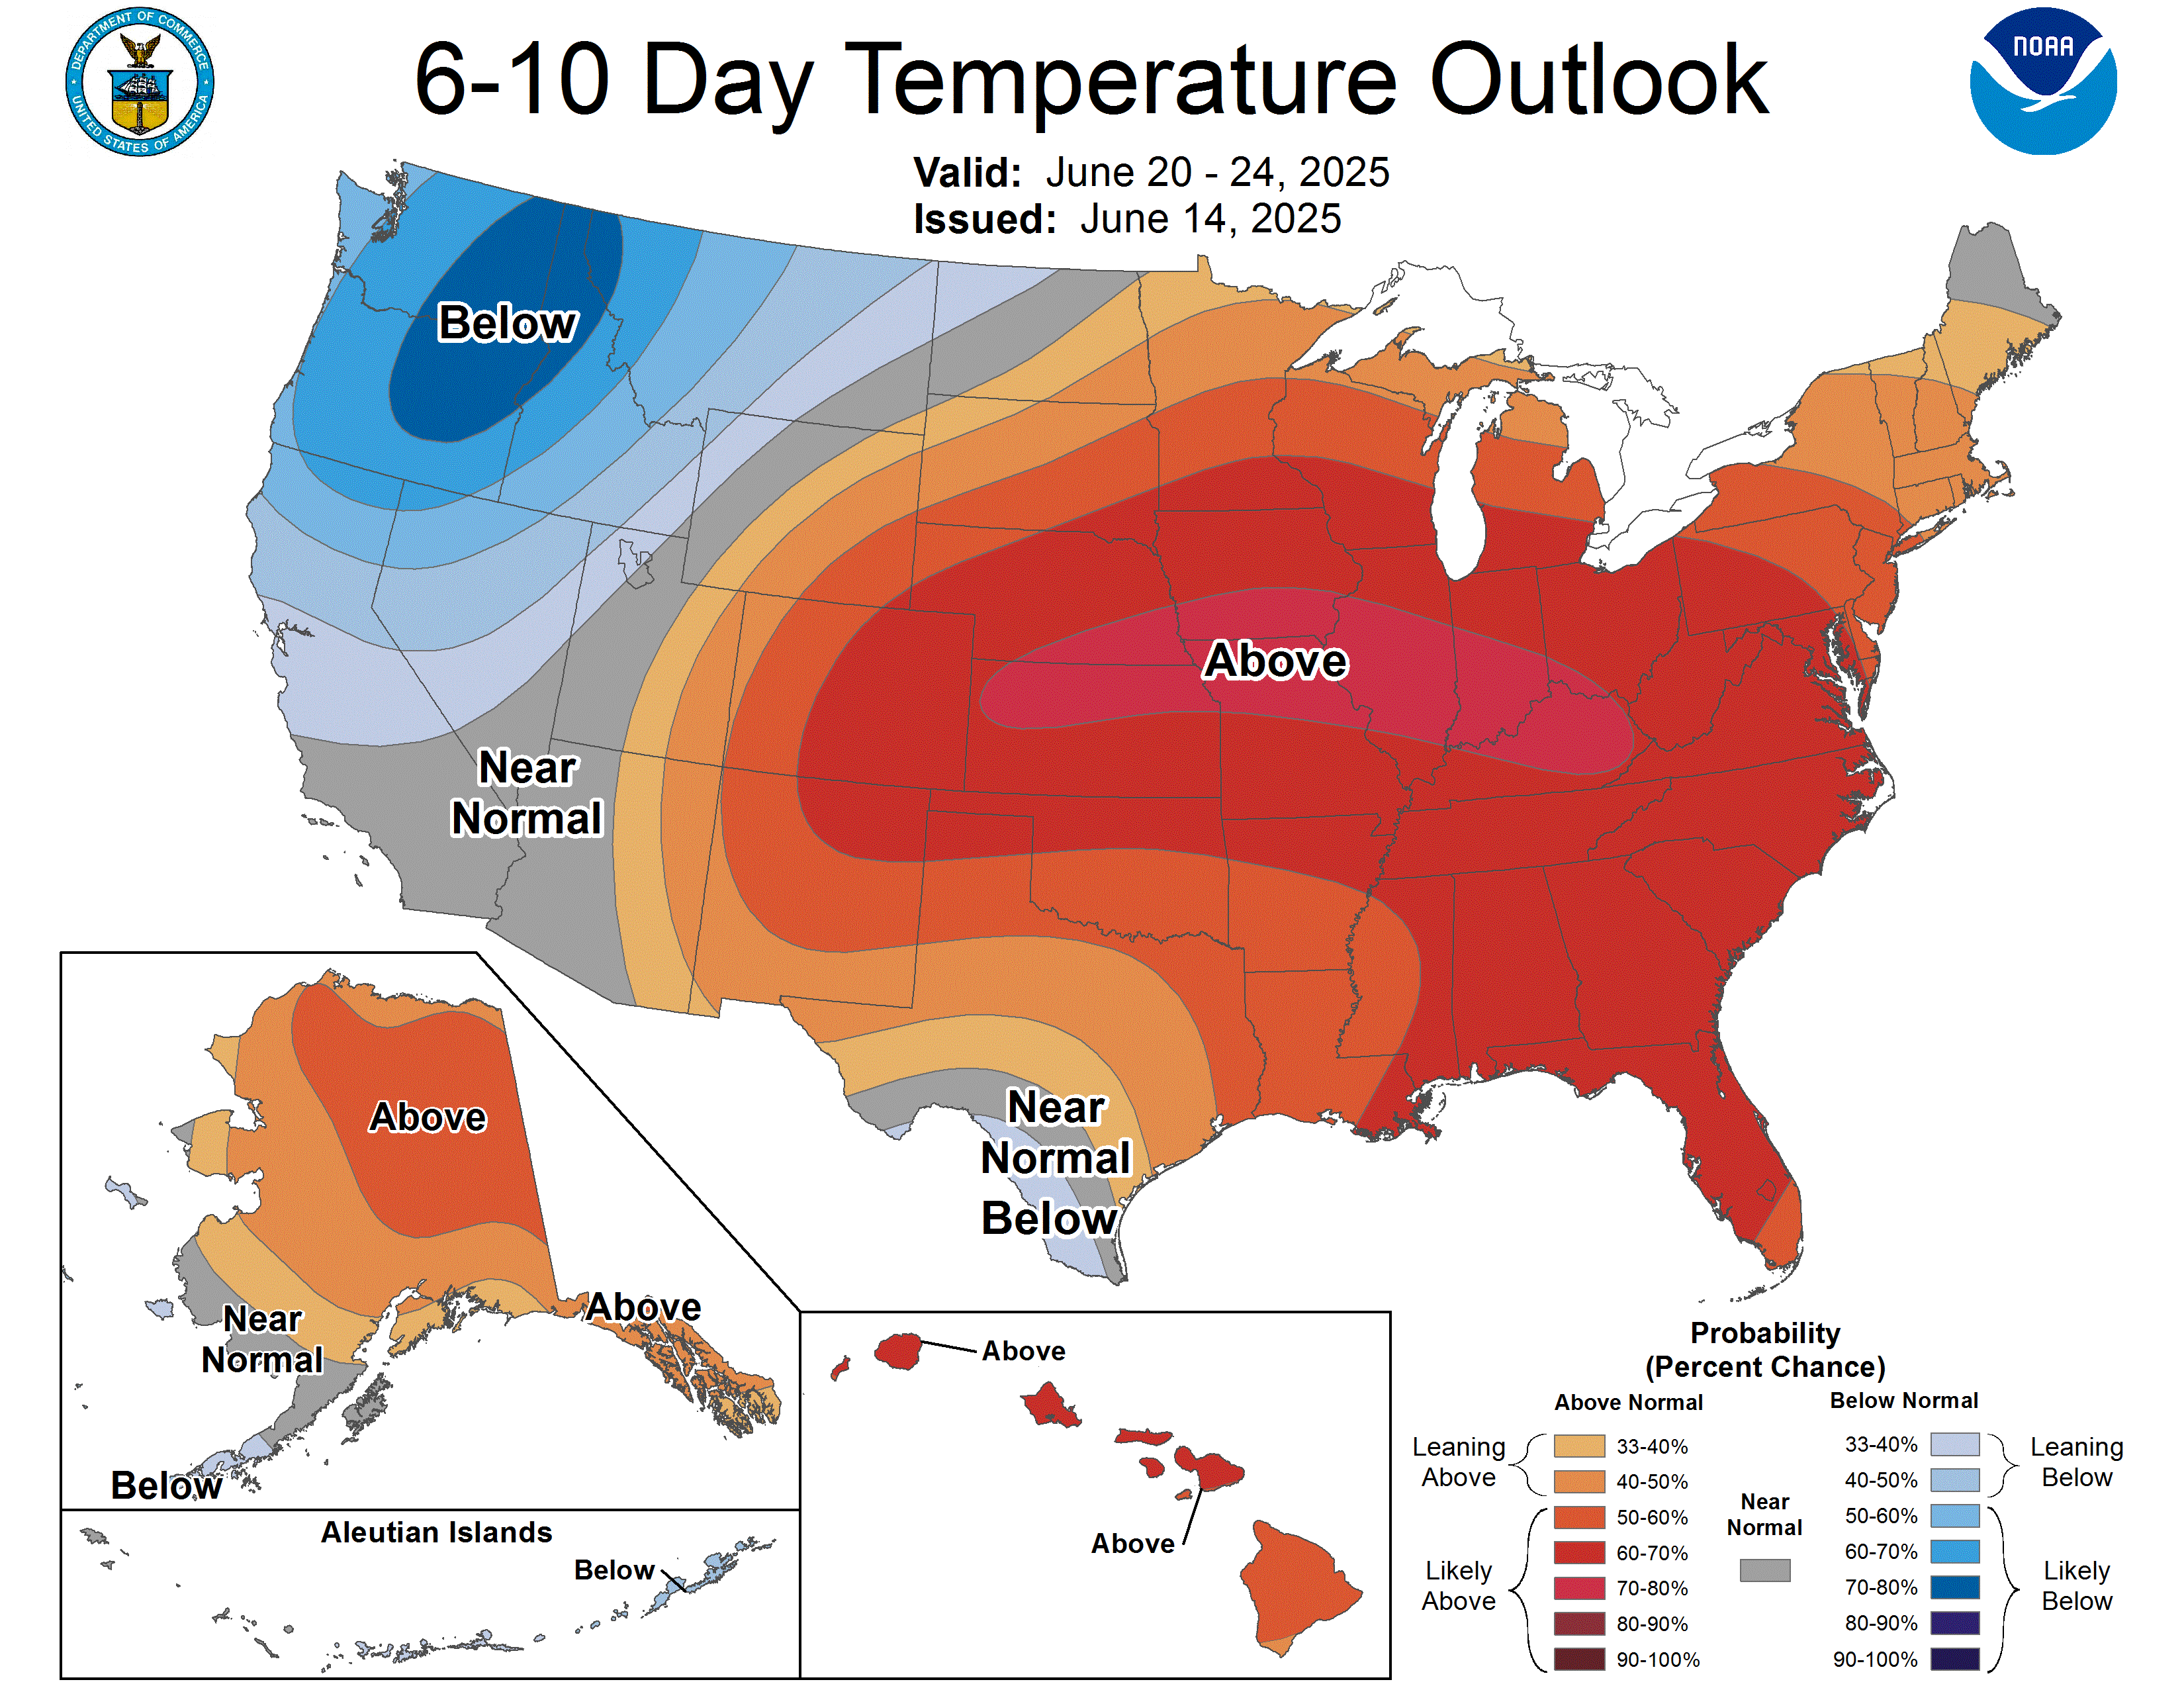
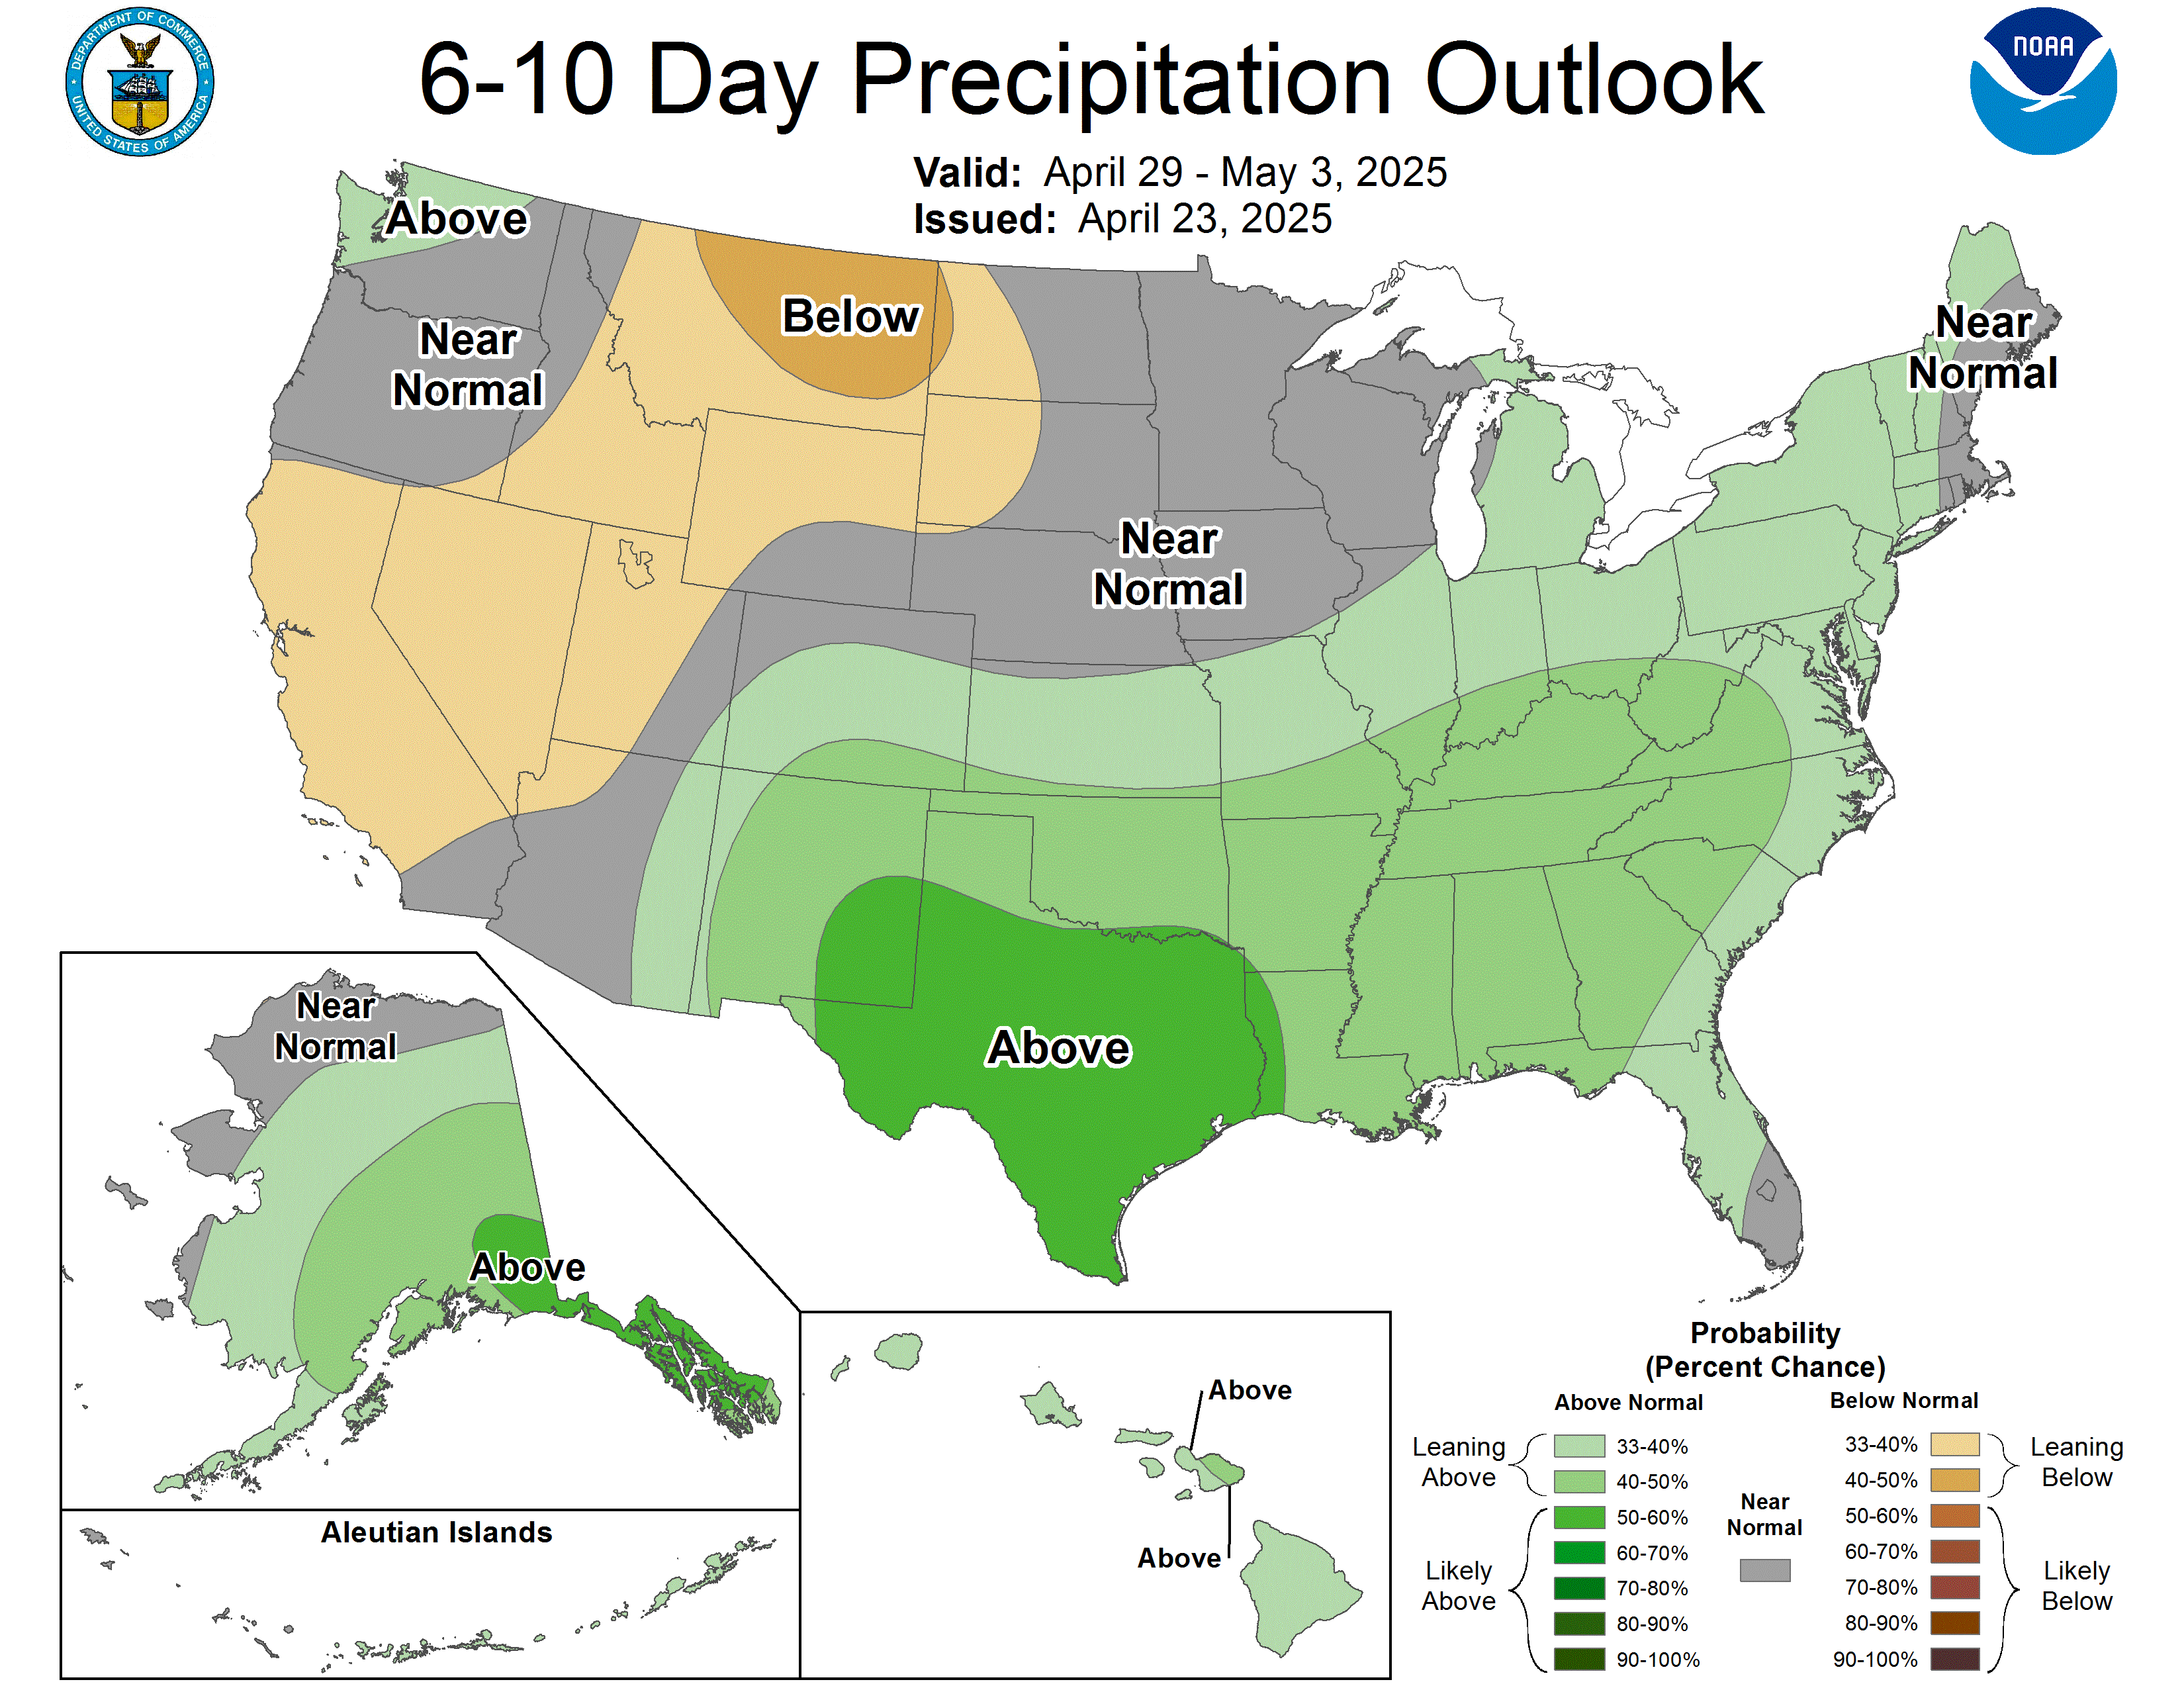
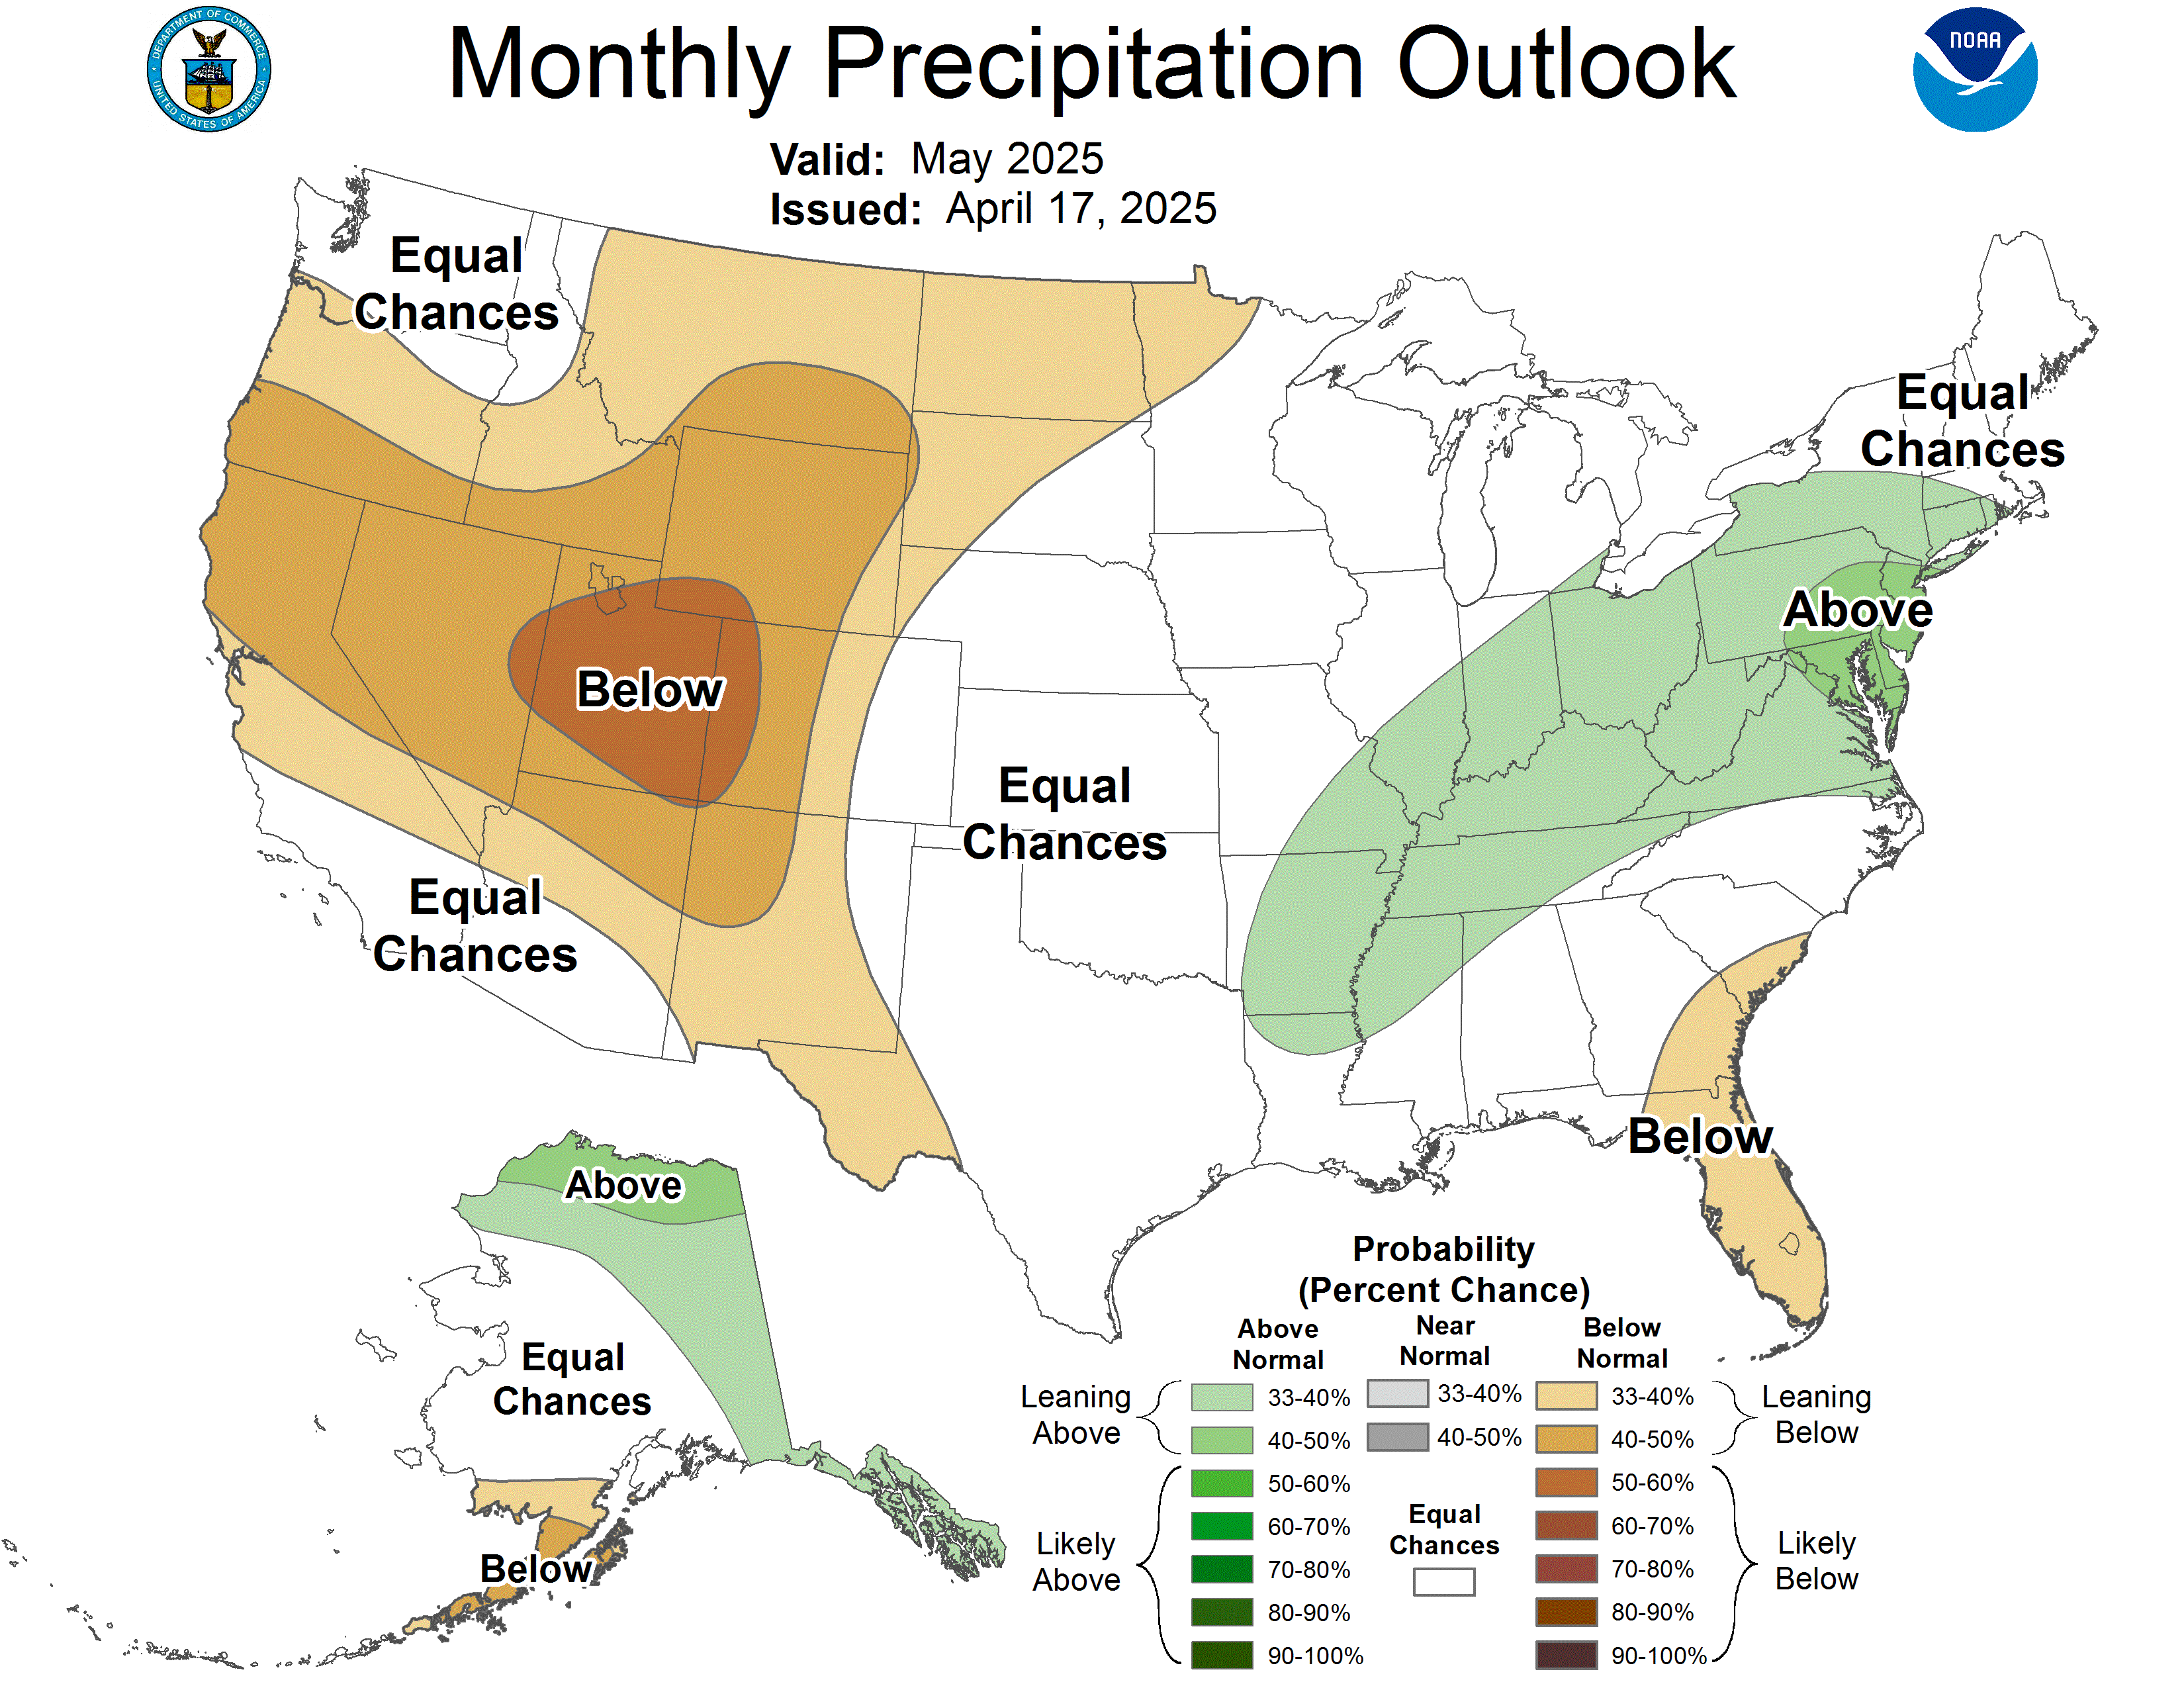
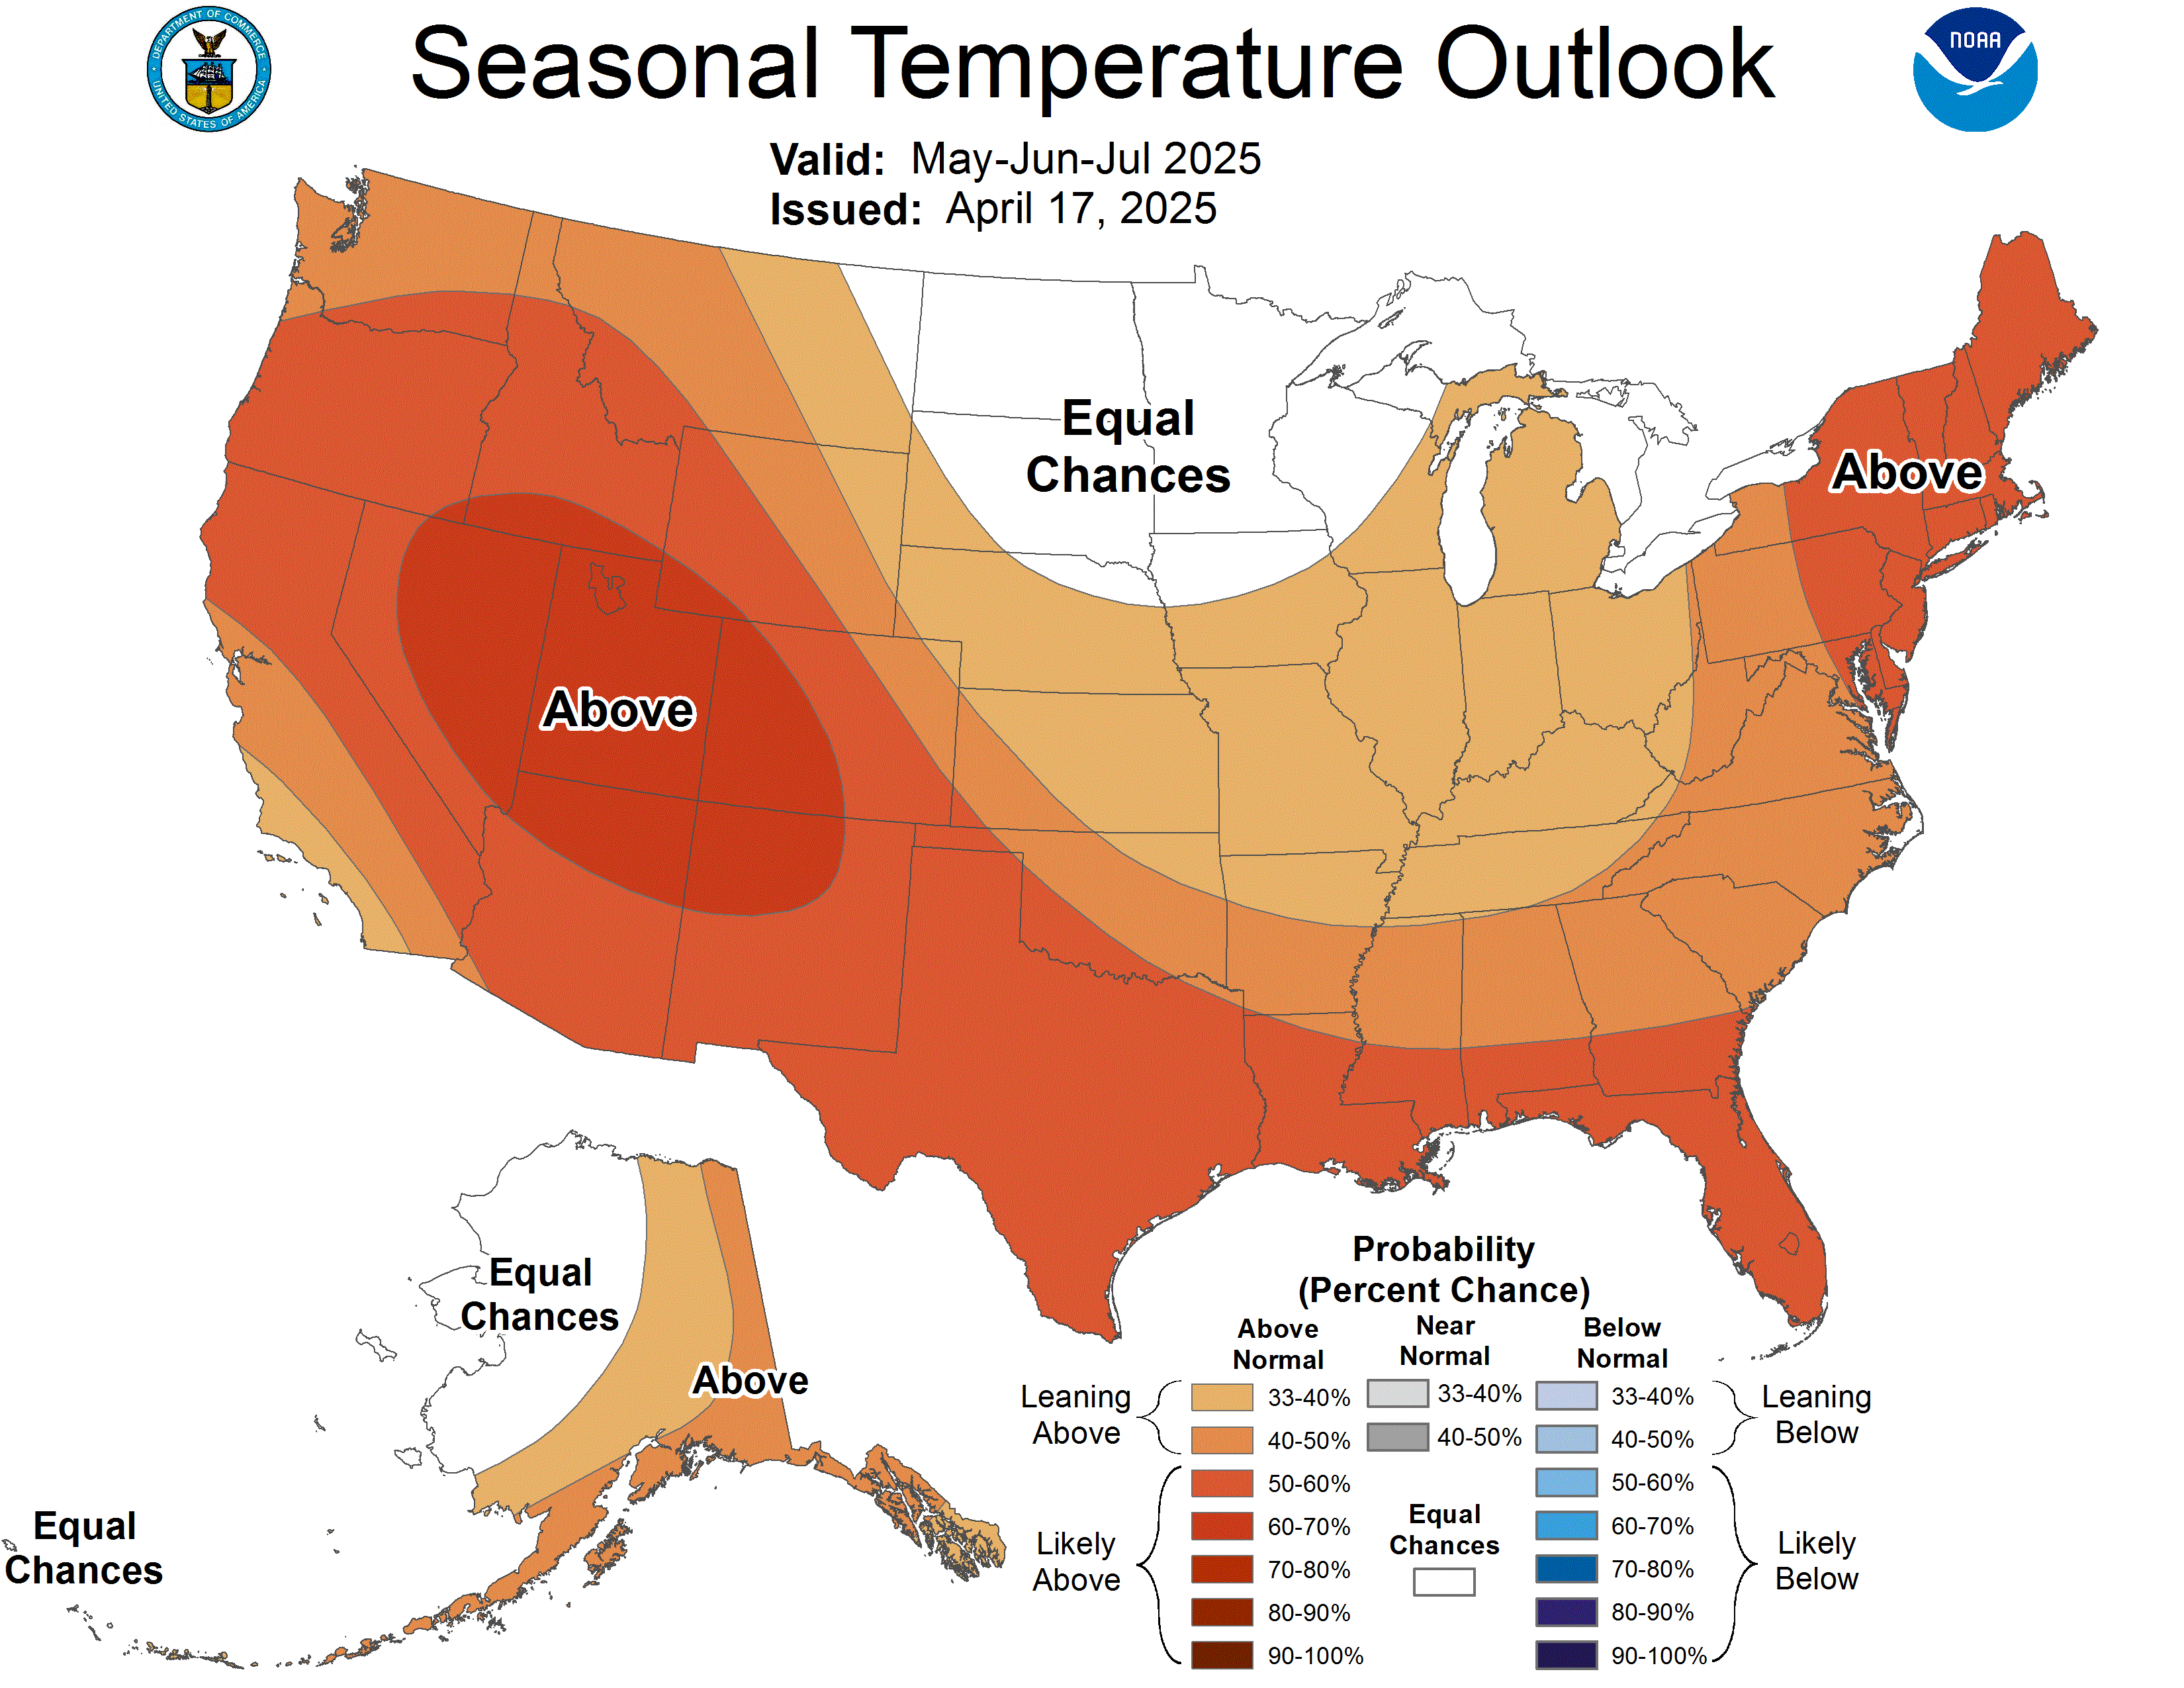
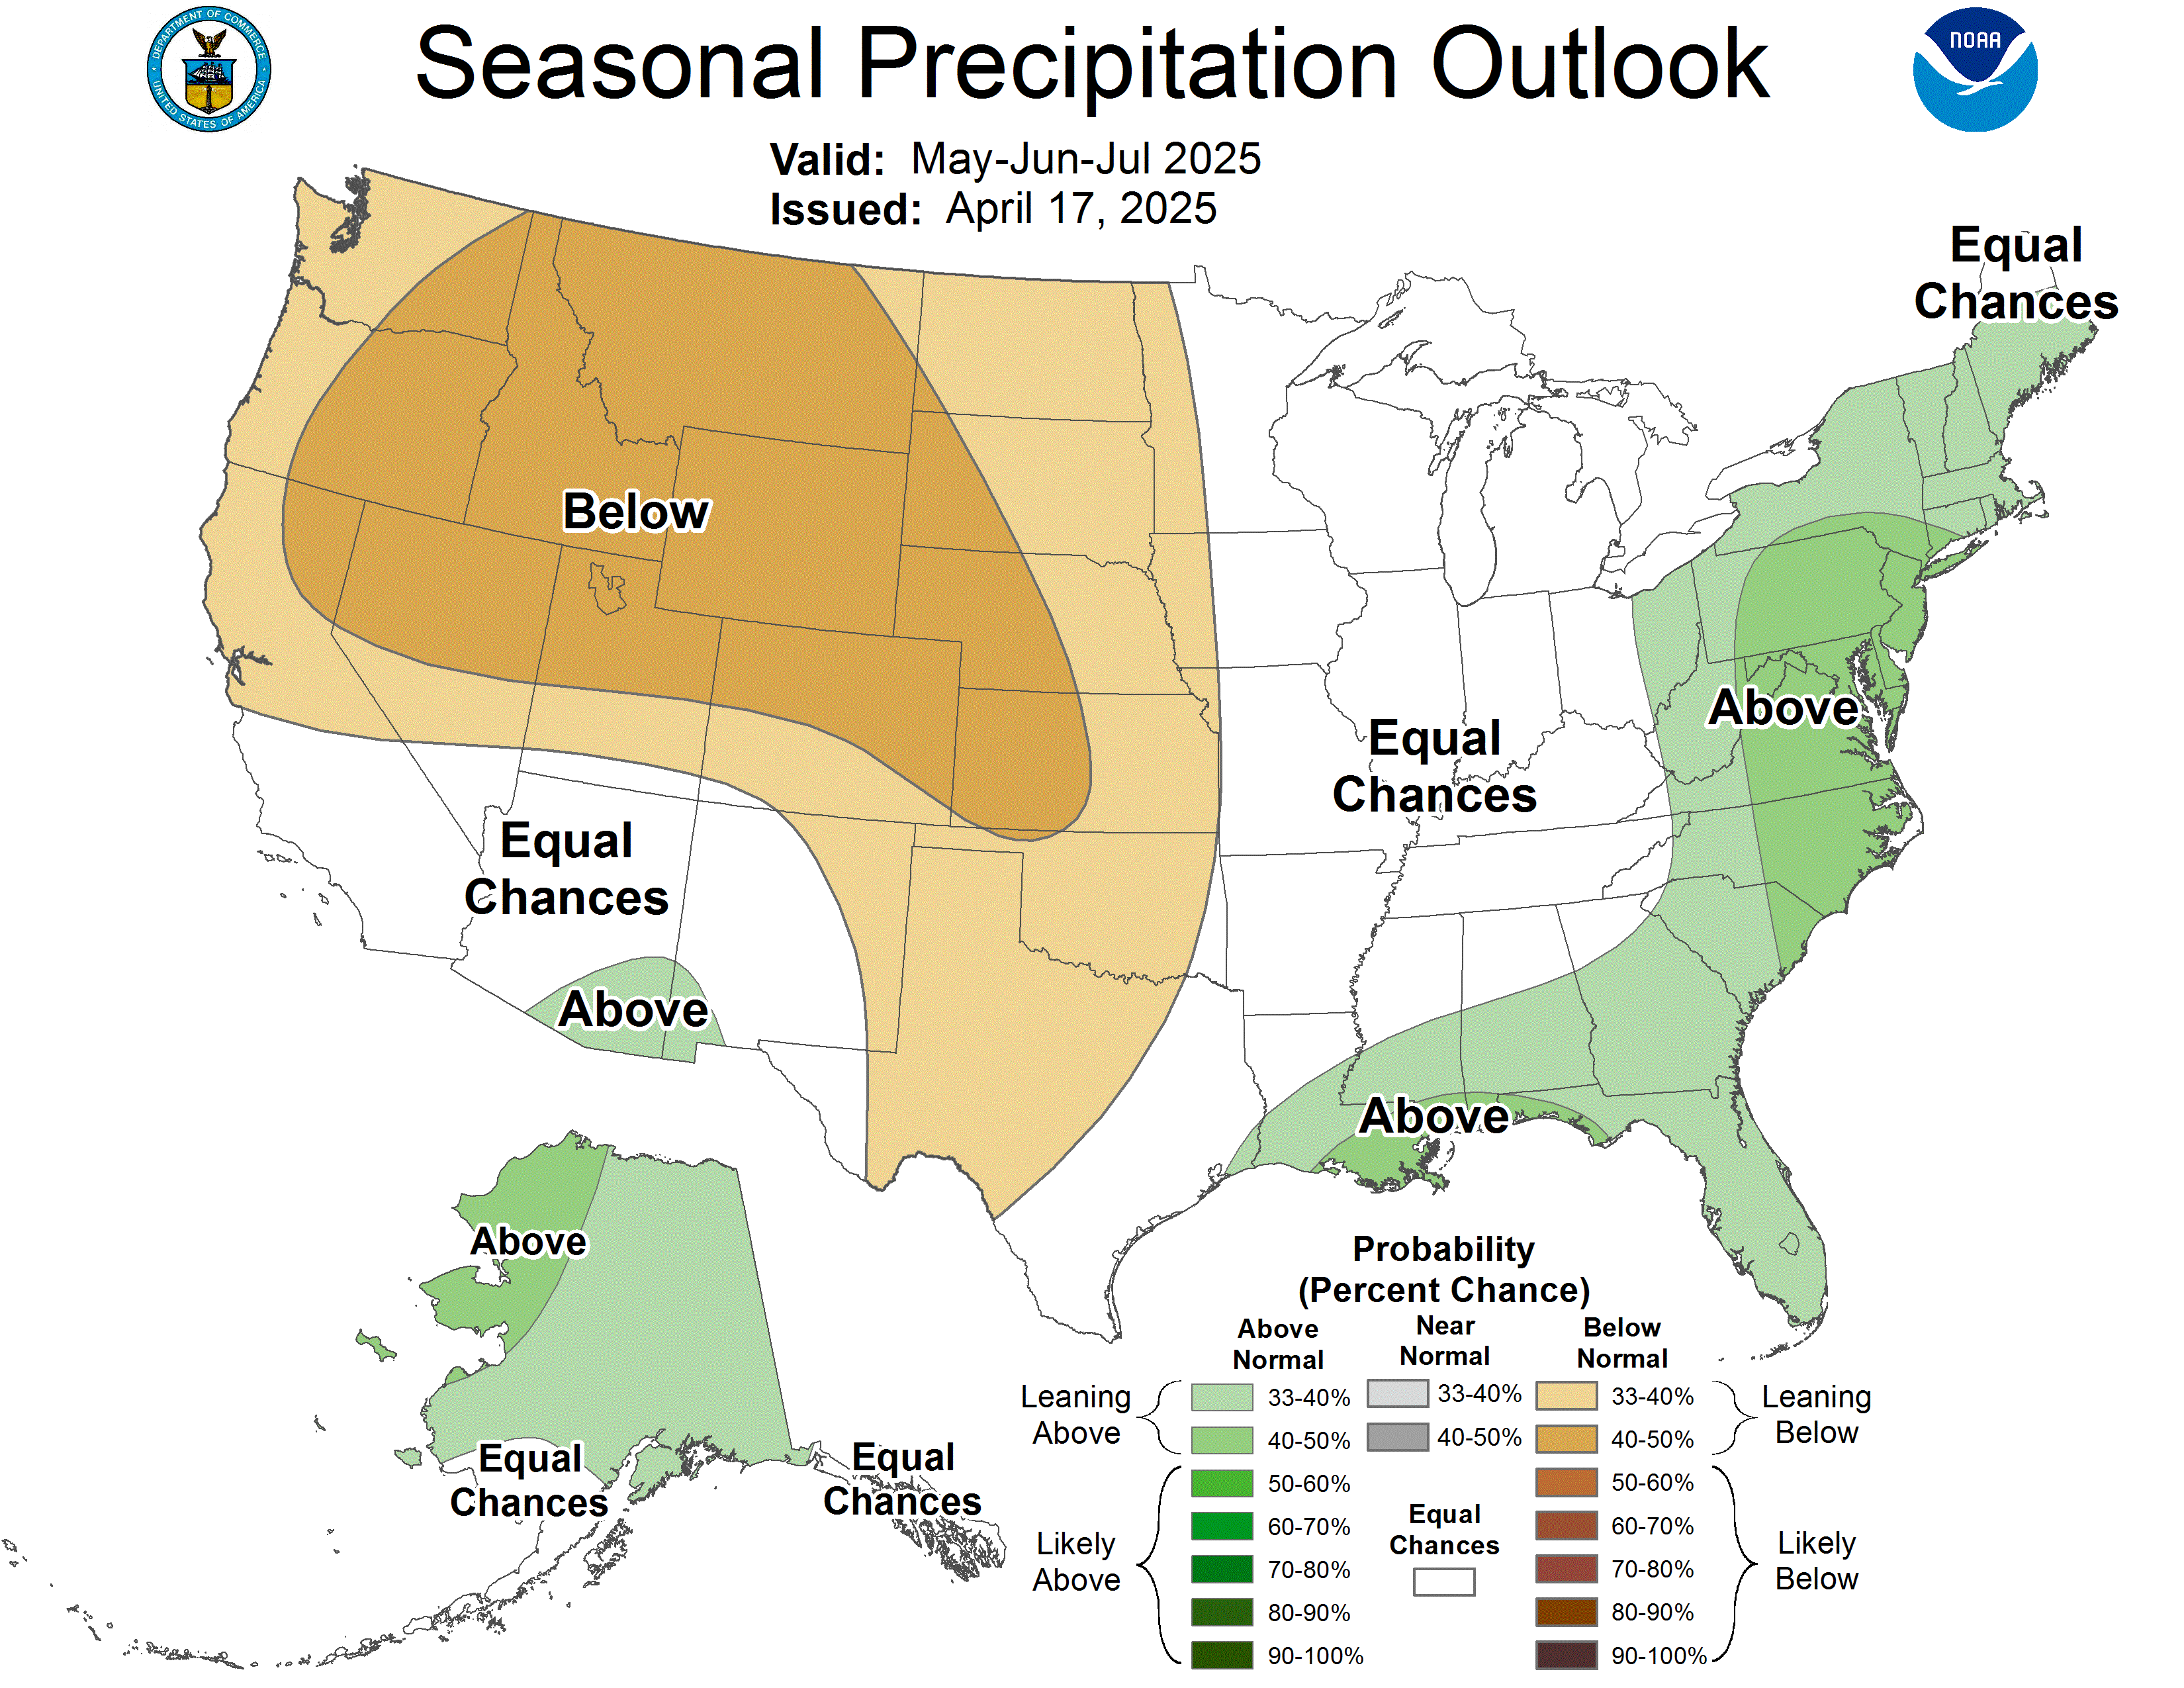
How to read the outlooks below. The colors show the odds of leaning above or below the 30-year normal, not an exact amount.
For temperature, orange/red leans warmer than normal and
blue leans colder.
For precipitation, green leans wetter (more chances for snow) and
brown leans drier.
White areas mean equal chances either way. These are national maps, so the same outlook covers every resort.
Next 6 to 10 Days
The closest long-range signal. Reissued every afternoon.
TemperatureSource: NOAA CPC ↗
Map temporarily unavailable. View on NOAA
PrecipitationSource: NOAA CPC ↗
Map temporarily unavailable. View on NOAA
Next 8 to 14 Days
Roughly the second week out. Reissued every afternoon.
TemperatureSource: NOAA CPC ↗
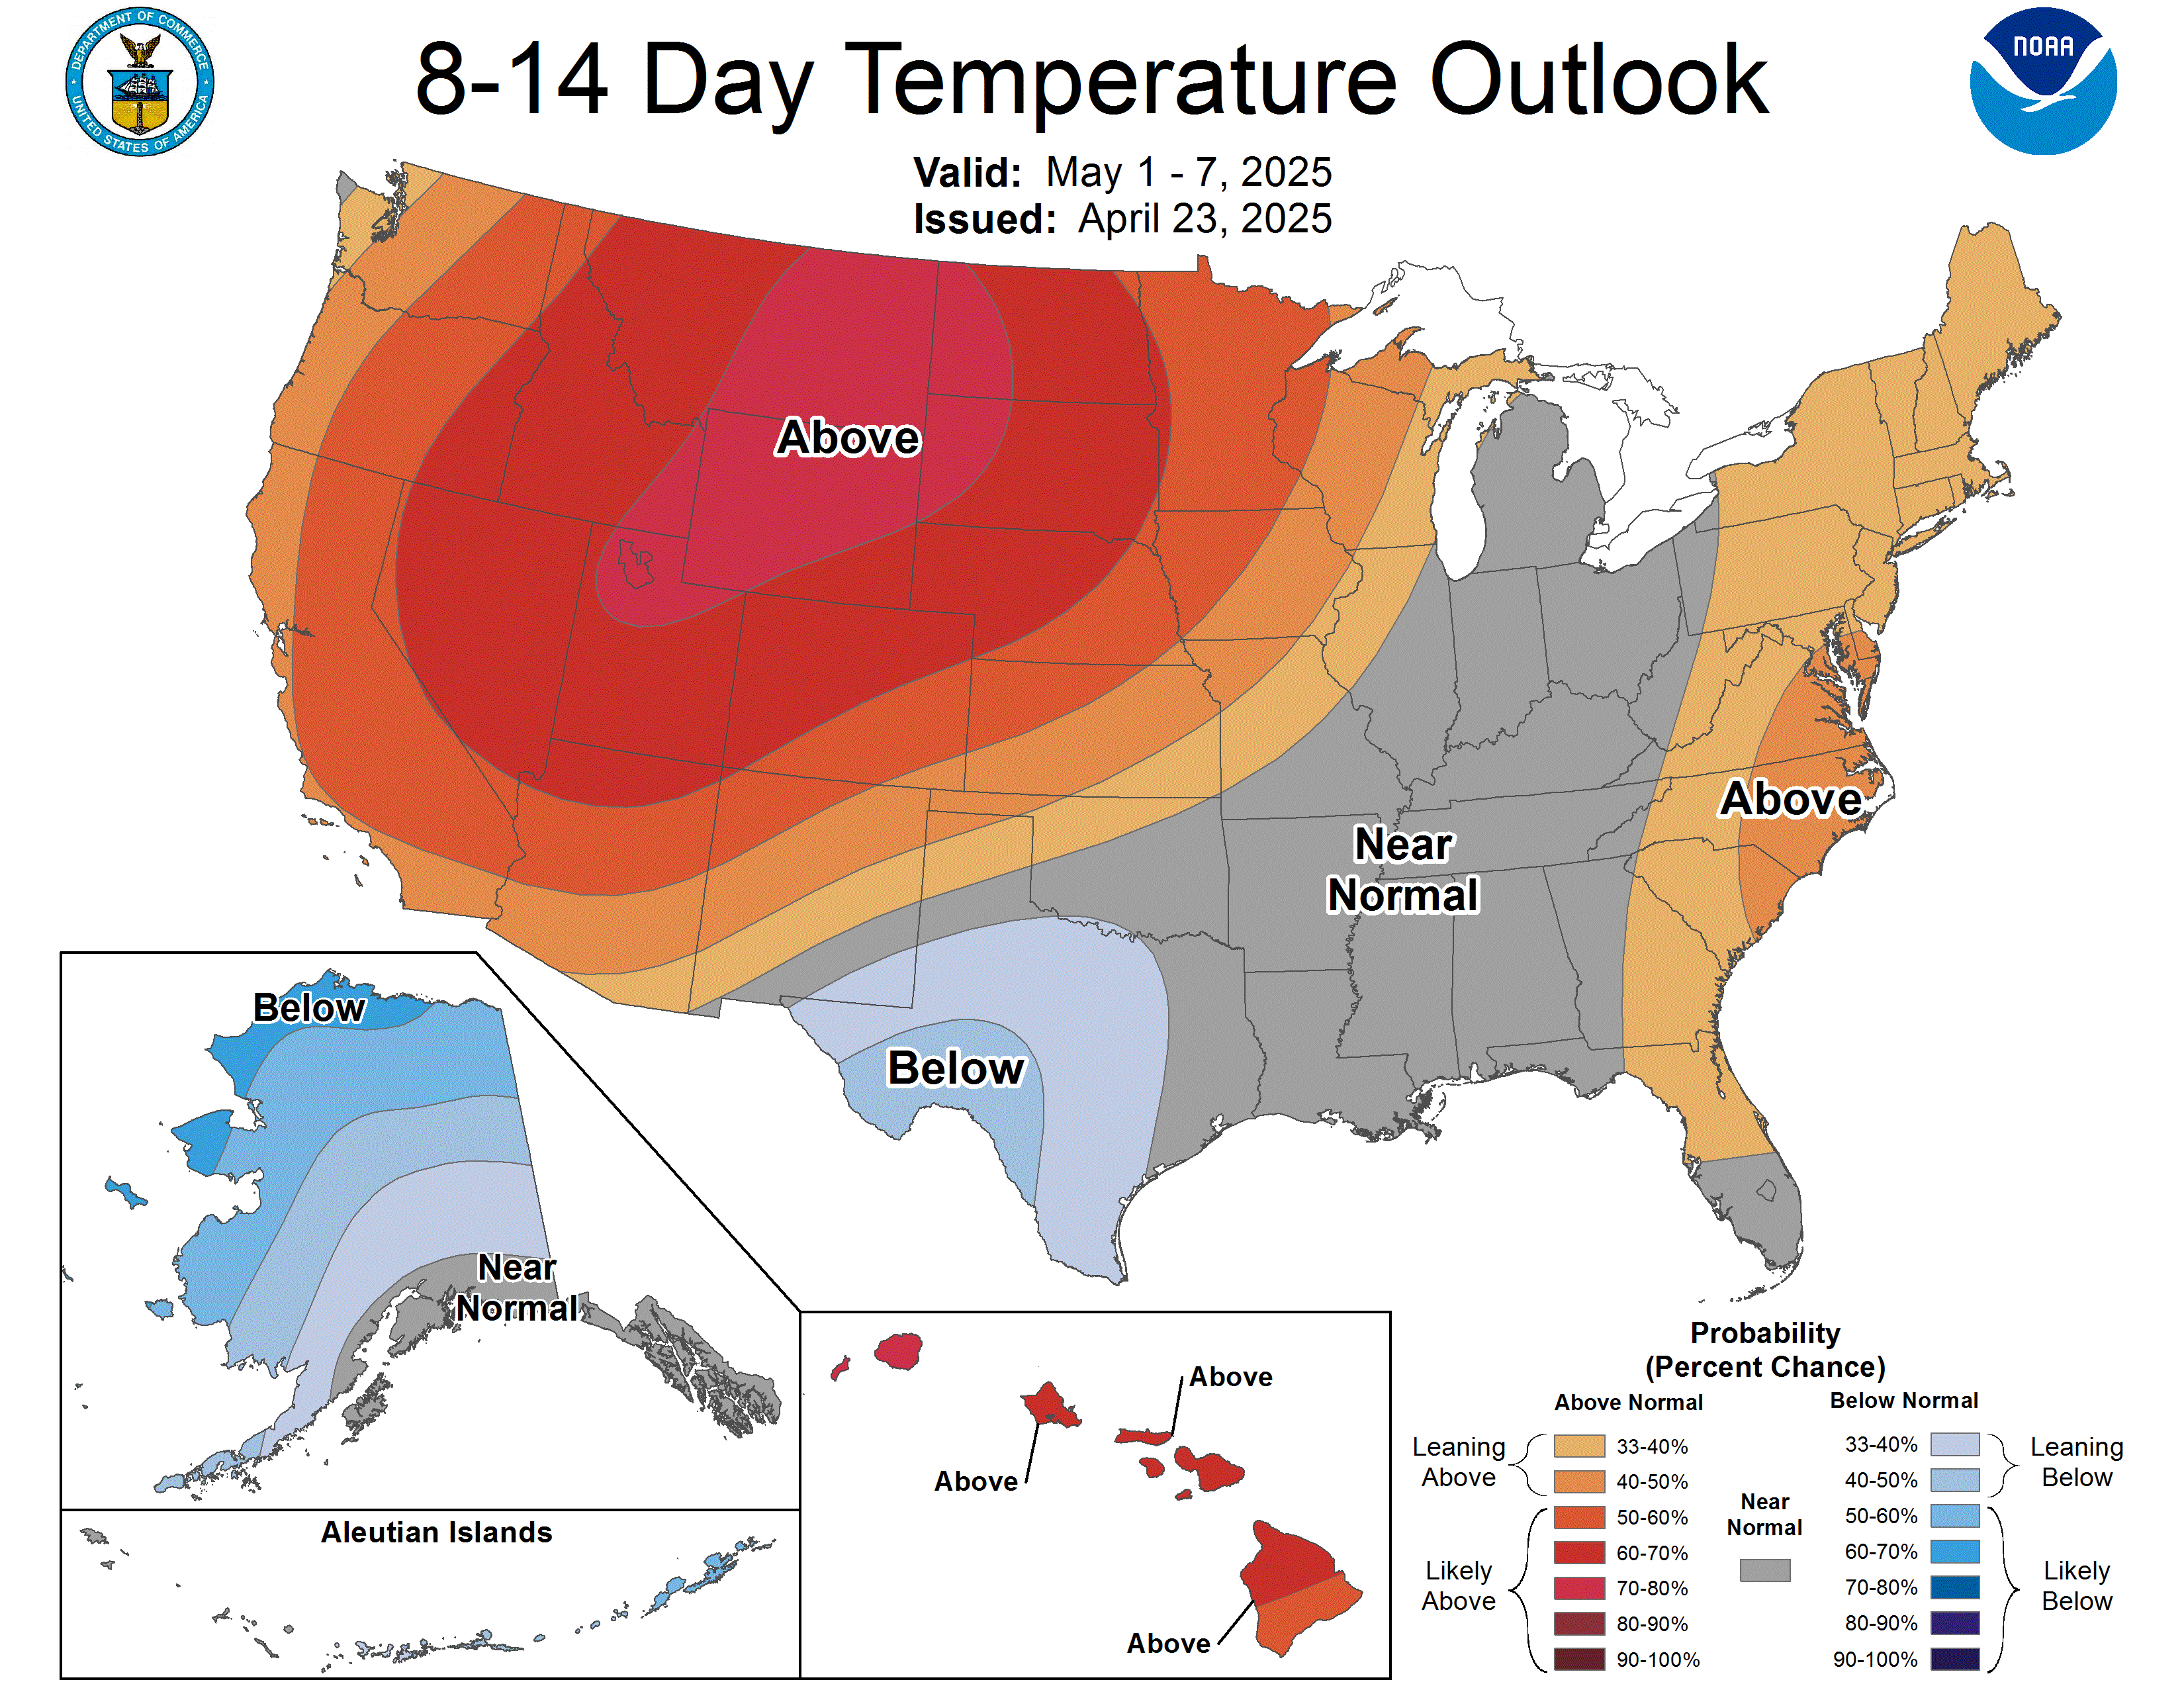
Map temporarily unavailable. View on NOAA
PrecipitationSource: NOAA CPC ↗
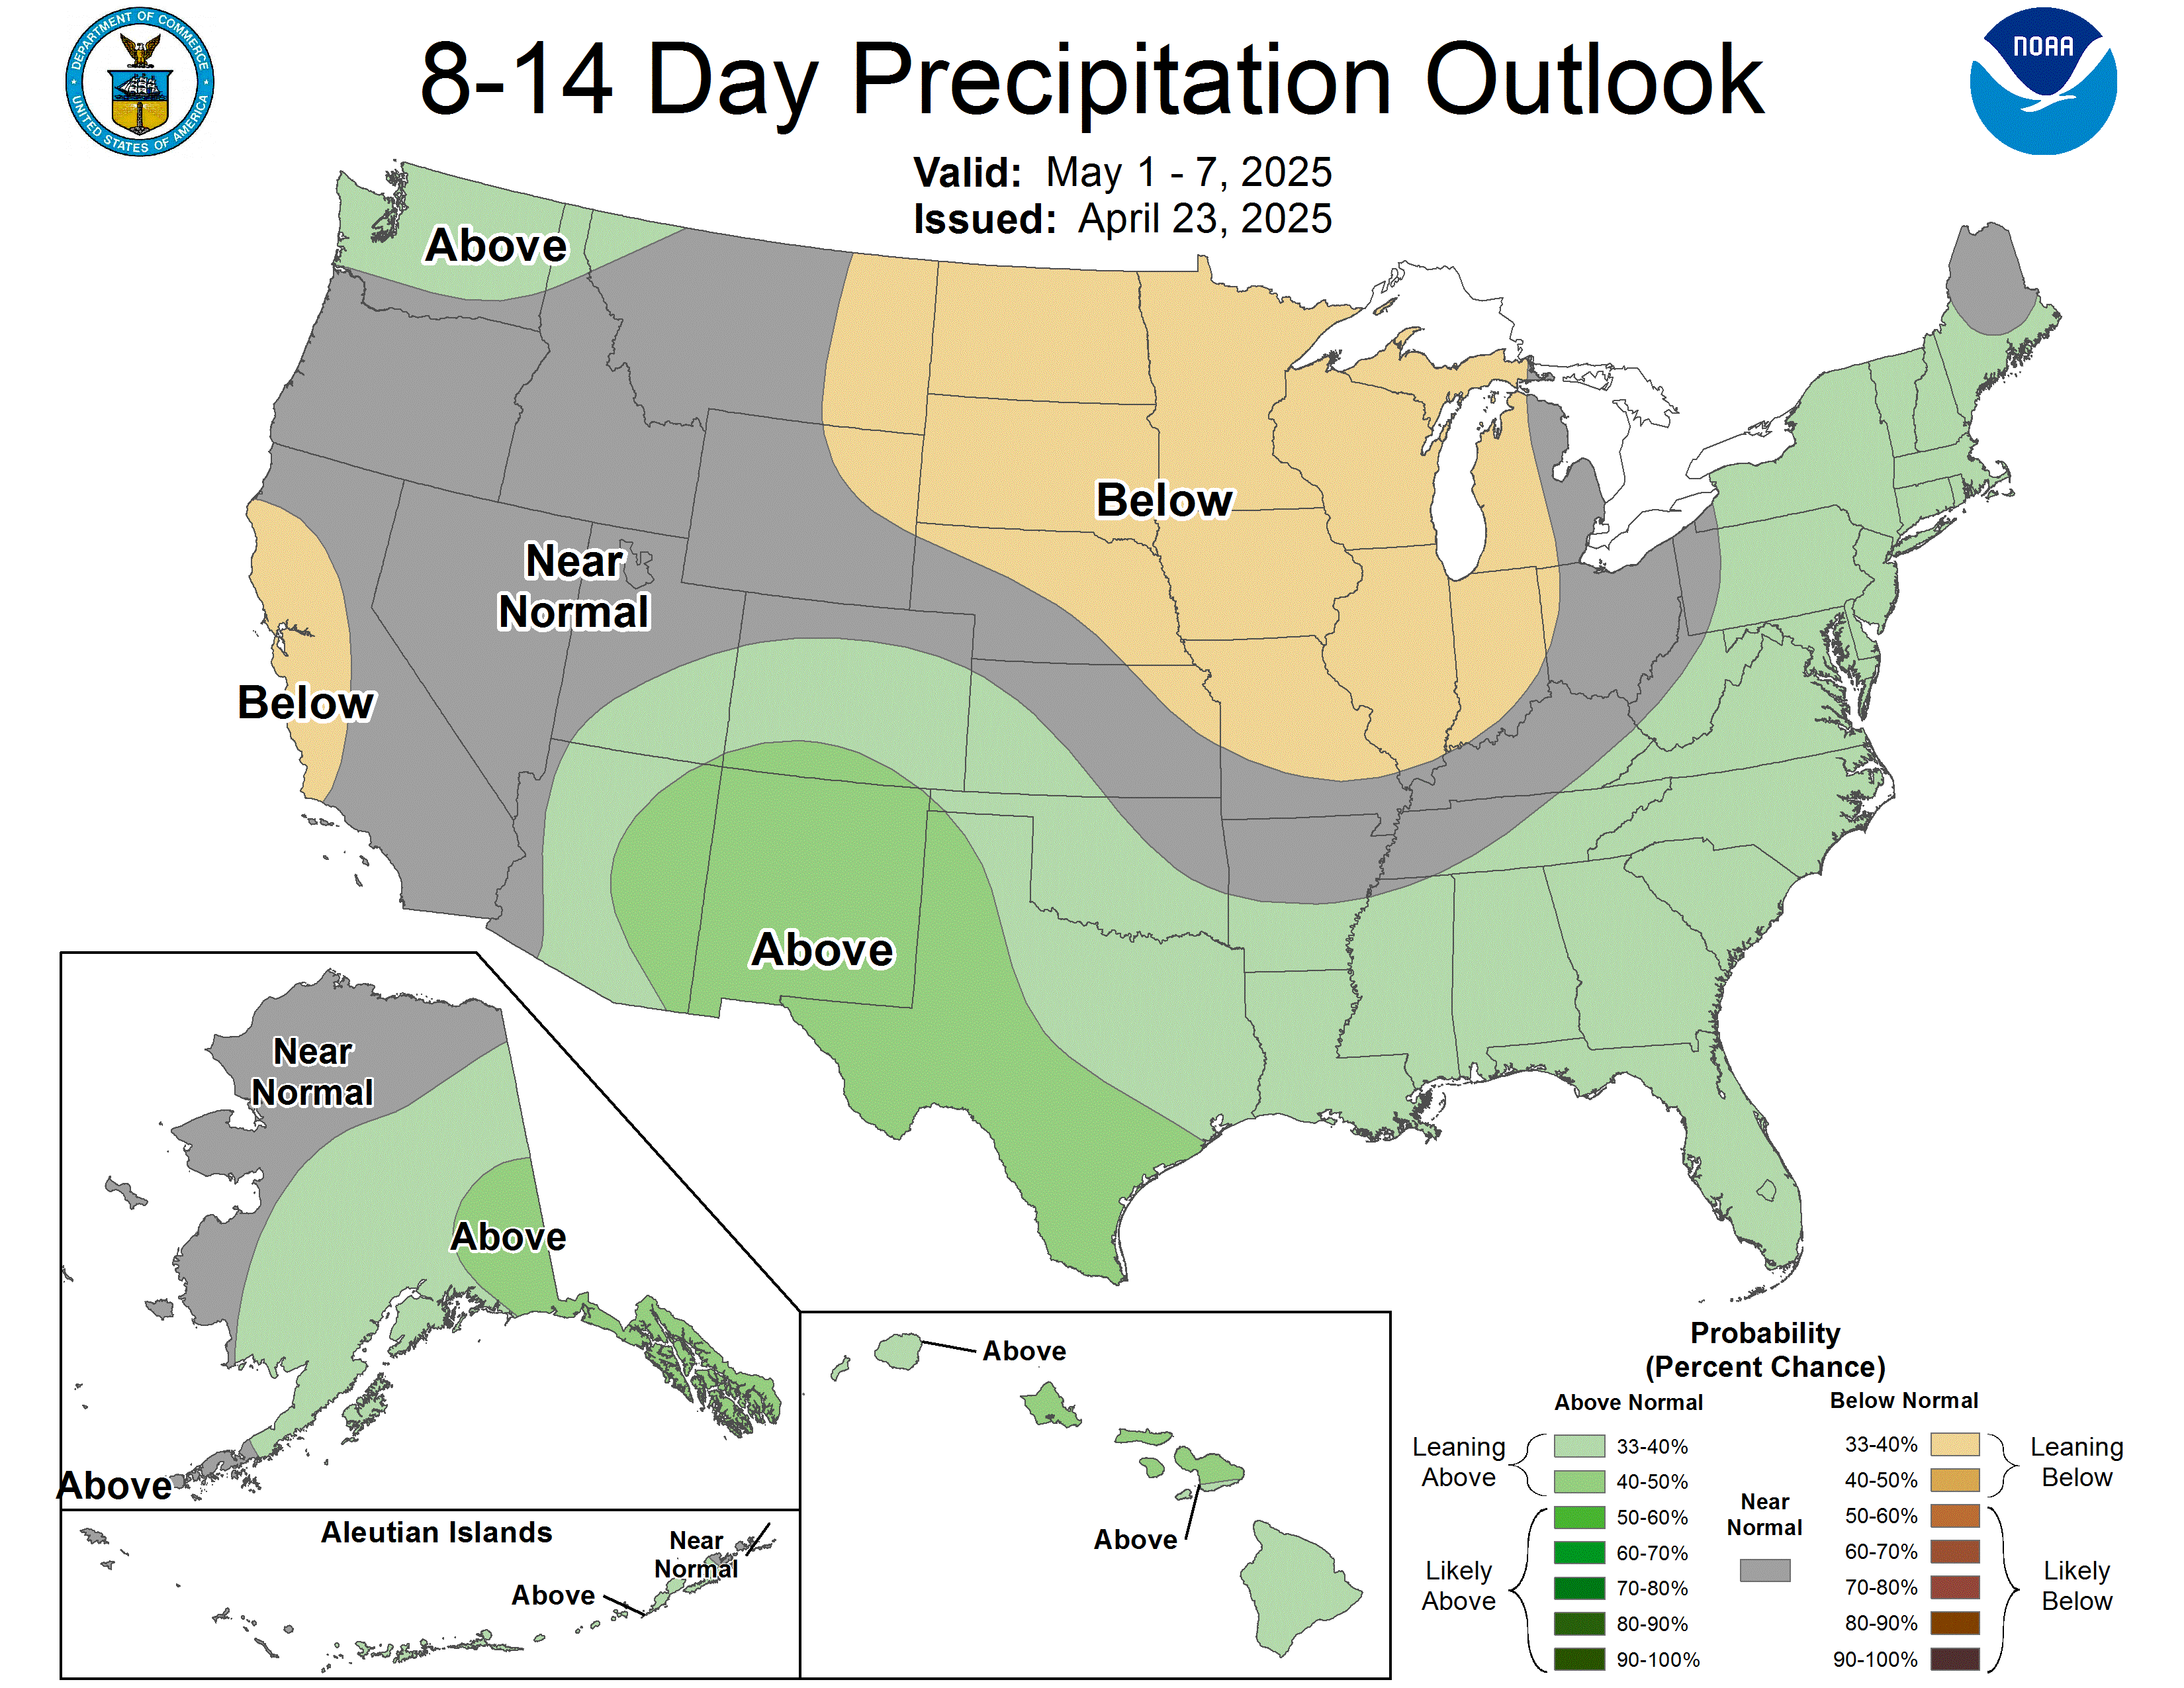
Map temporarily unavailable. View on NOAA
8 to 14 Day Snow Hazards
The one map built for exactly what we care about: where NOAA sees a real chance of heavy snow in the second week out.
Probabilistic Snow HazardsSource: NOAA CPC ↗
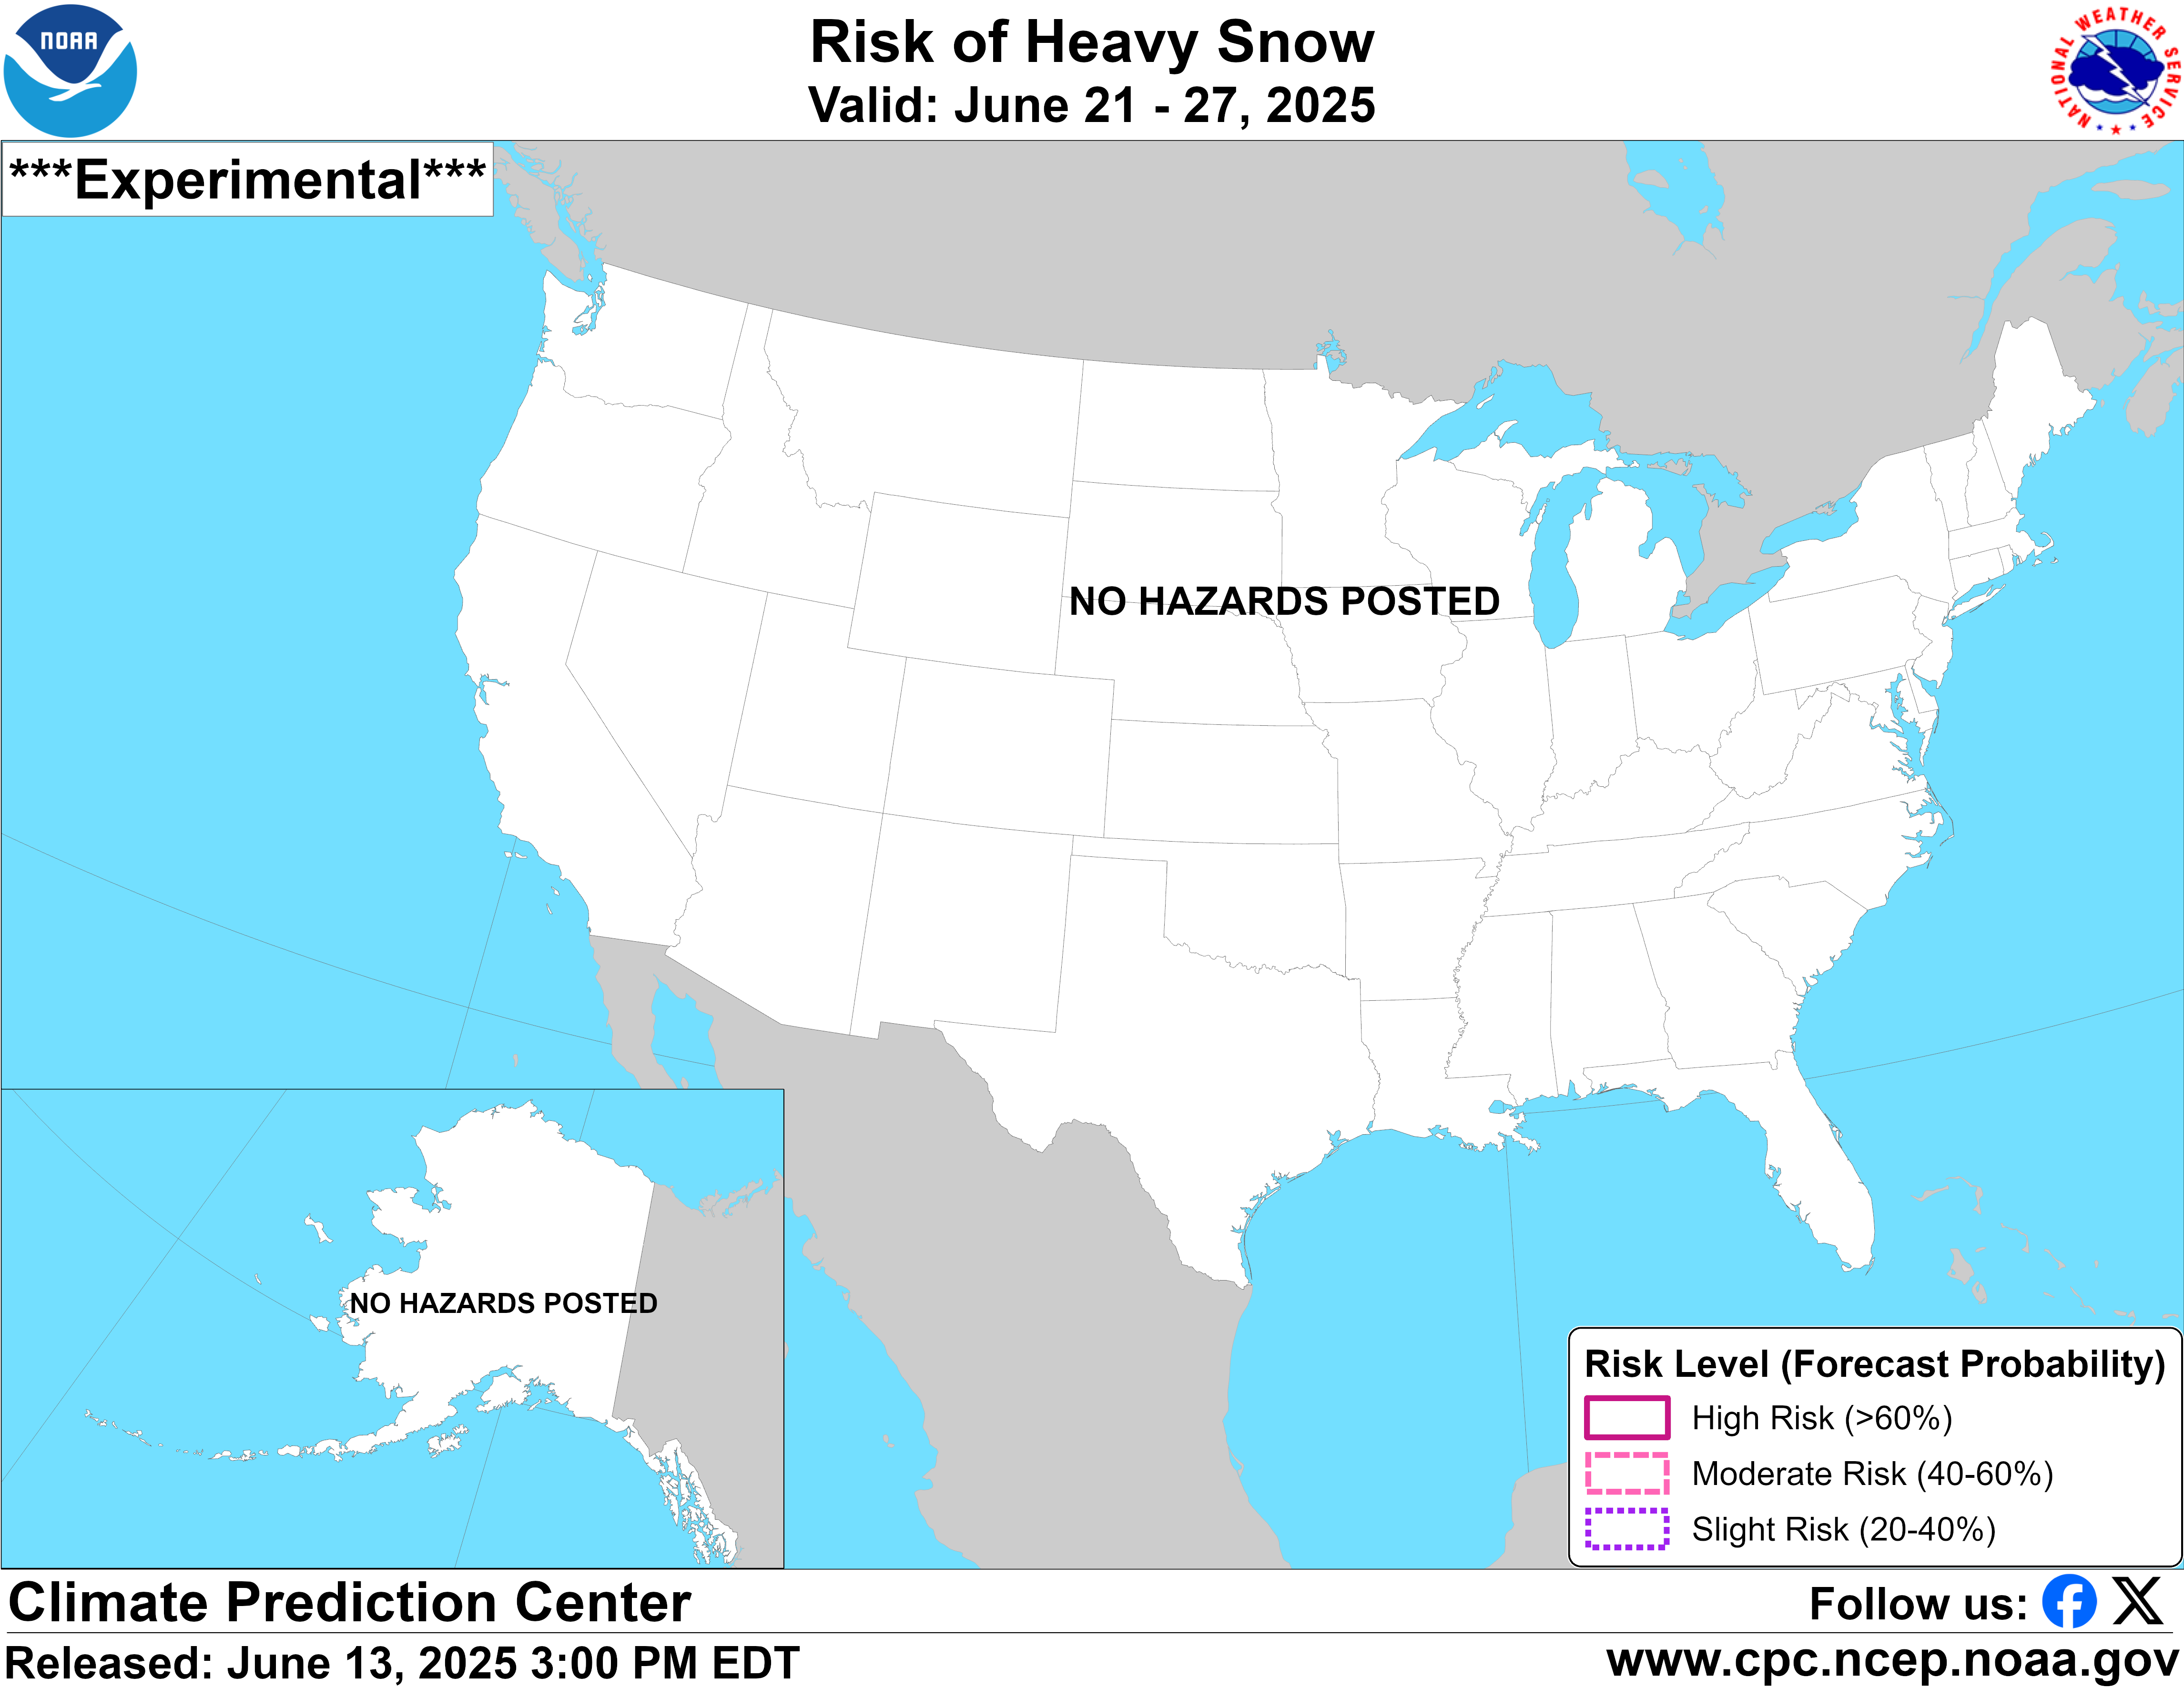
Map temporarily unavailable. View on NOAA
Shaded areas flag an elevated chance of heavy snow. Blank most of the year, and worth watching when it lights up over the mountains.
Month Ahead
The next 30 days. Updated around mid-month and again at month-end.
TemperatureSource: NOAA CPC ↗
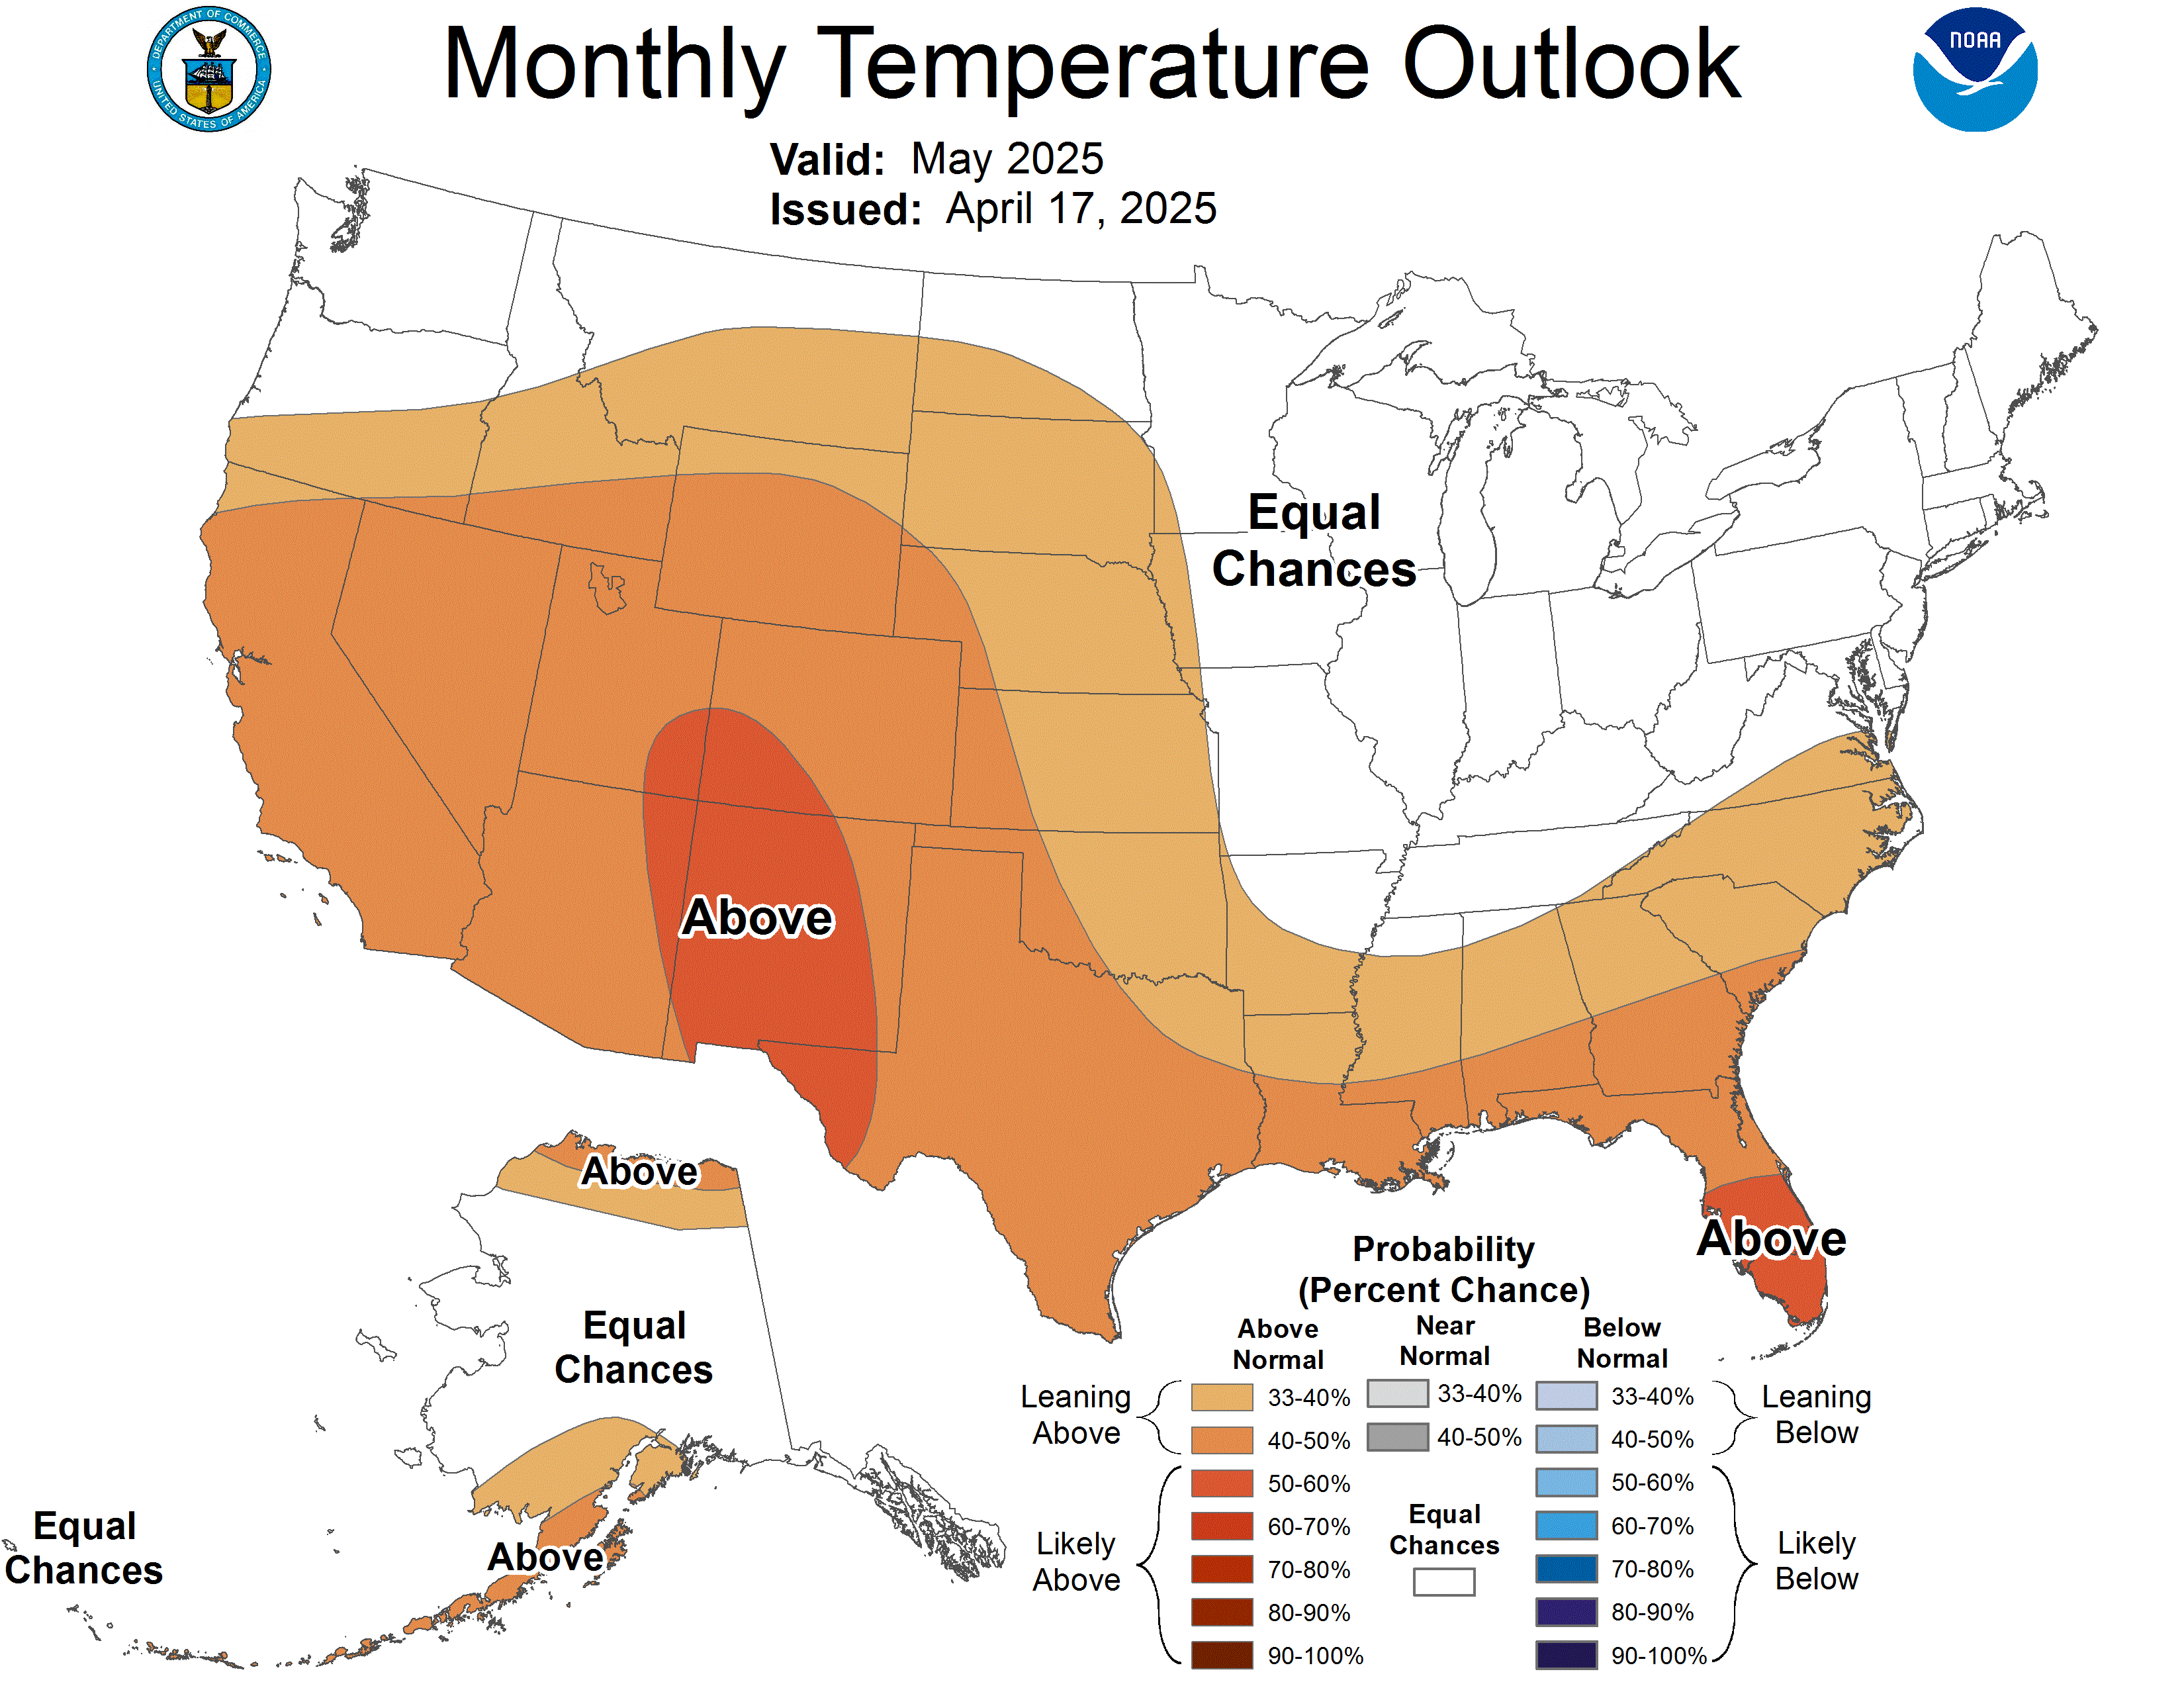
Map temporarily unavailable. View on NOAA
PrecipitationSource: NOAA CPC ↗
Map temporarily unavailable. View on NOAA
Season Ahead (3 Months)
The big-picture pattern for the next three months. Updated monthly.
TemperatureSource: NOAA CPC ↗
Map temporarily unavailable. View on NOAA
PrecipitationSource: NOAA CPC ↗
Map temporarily unavailable. View on NOAA
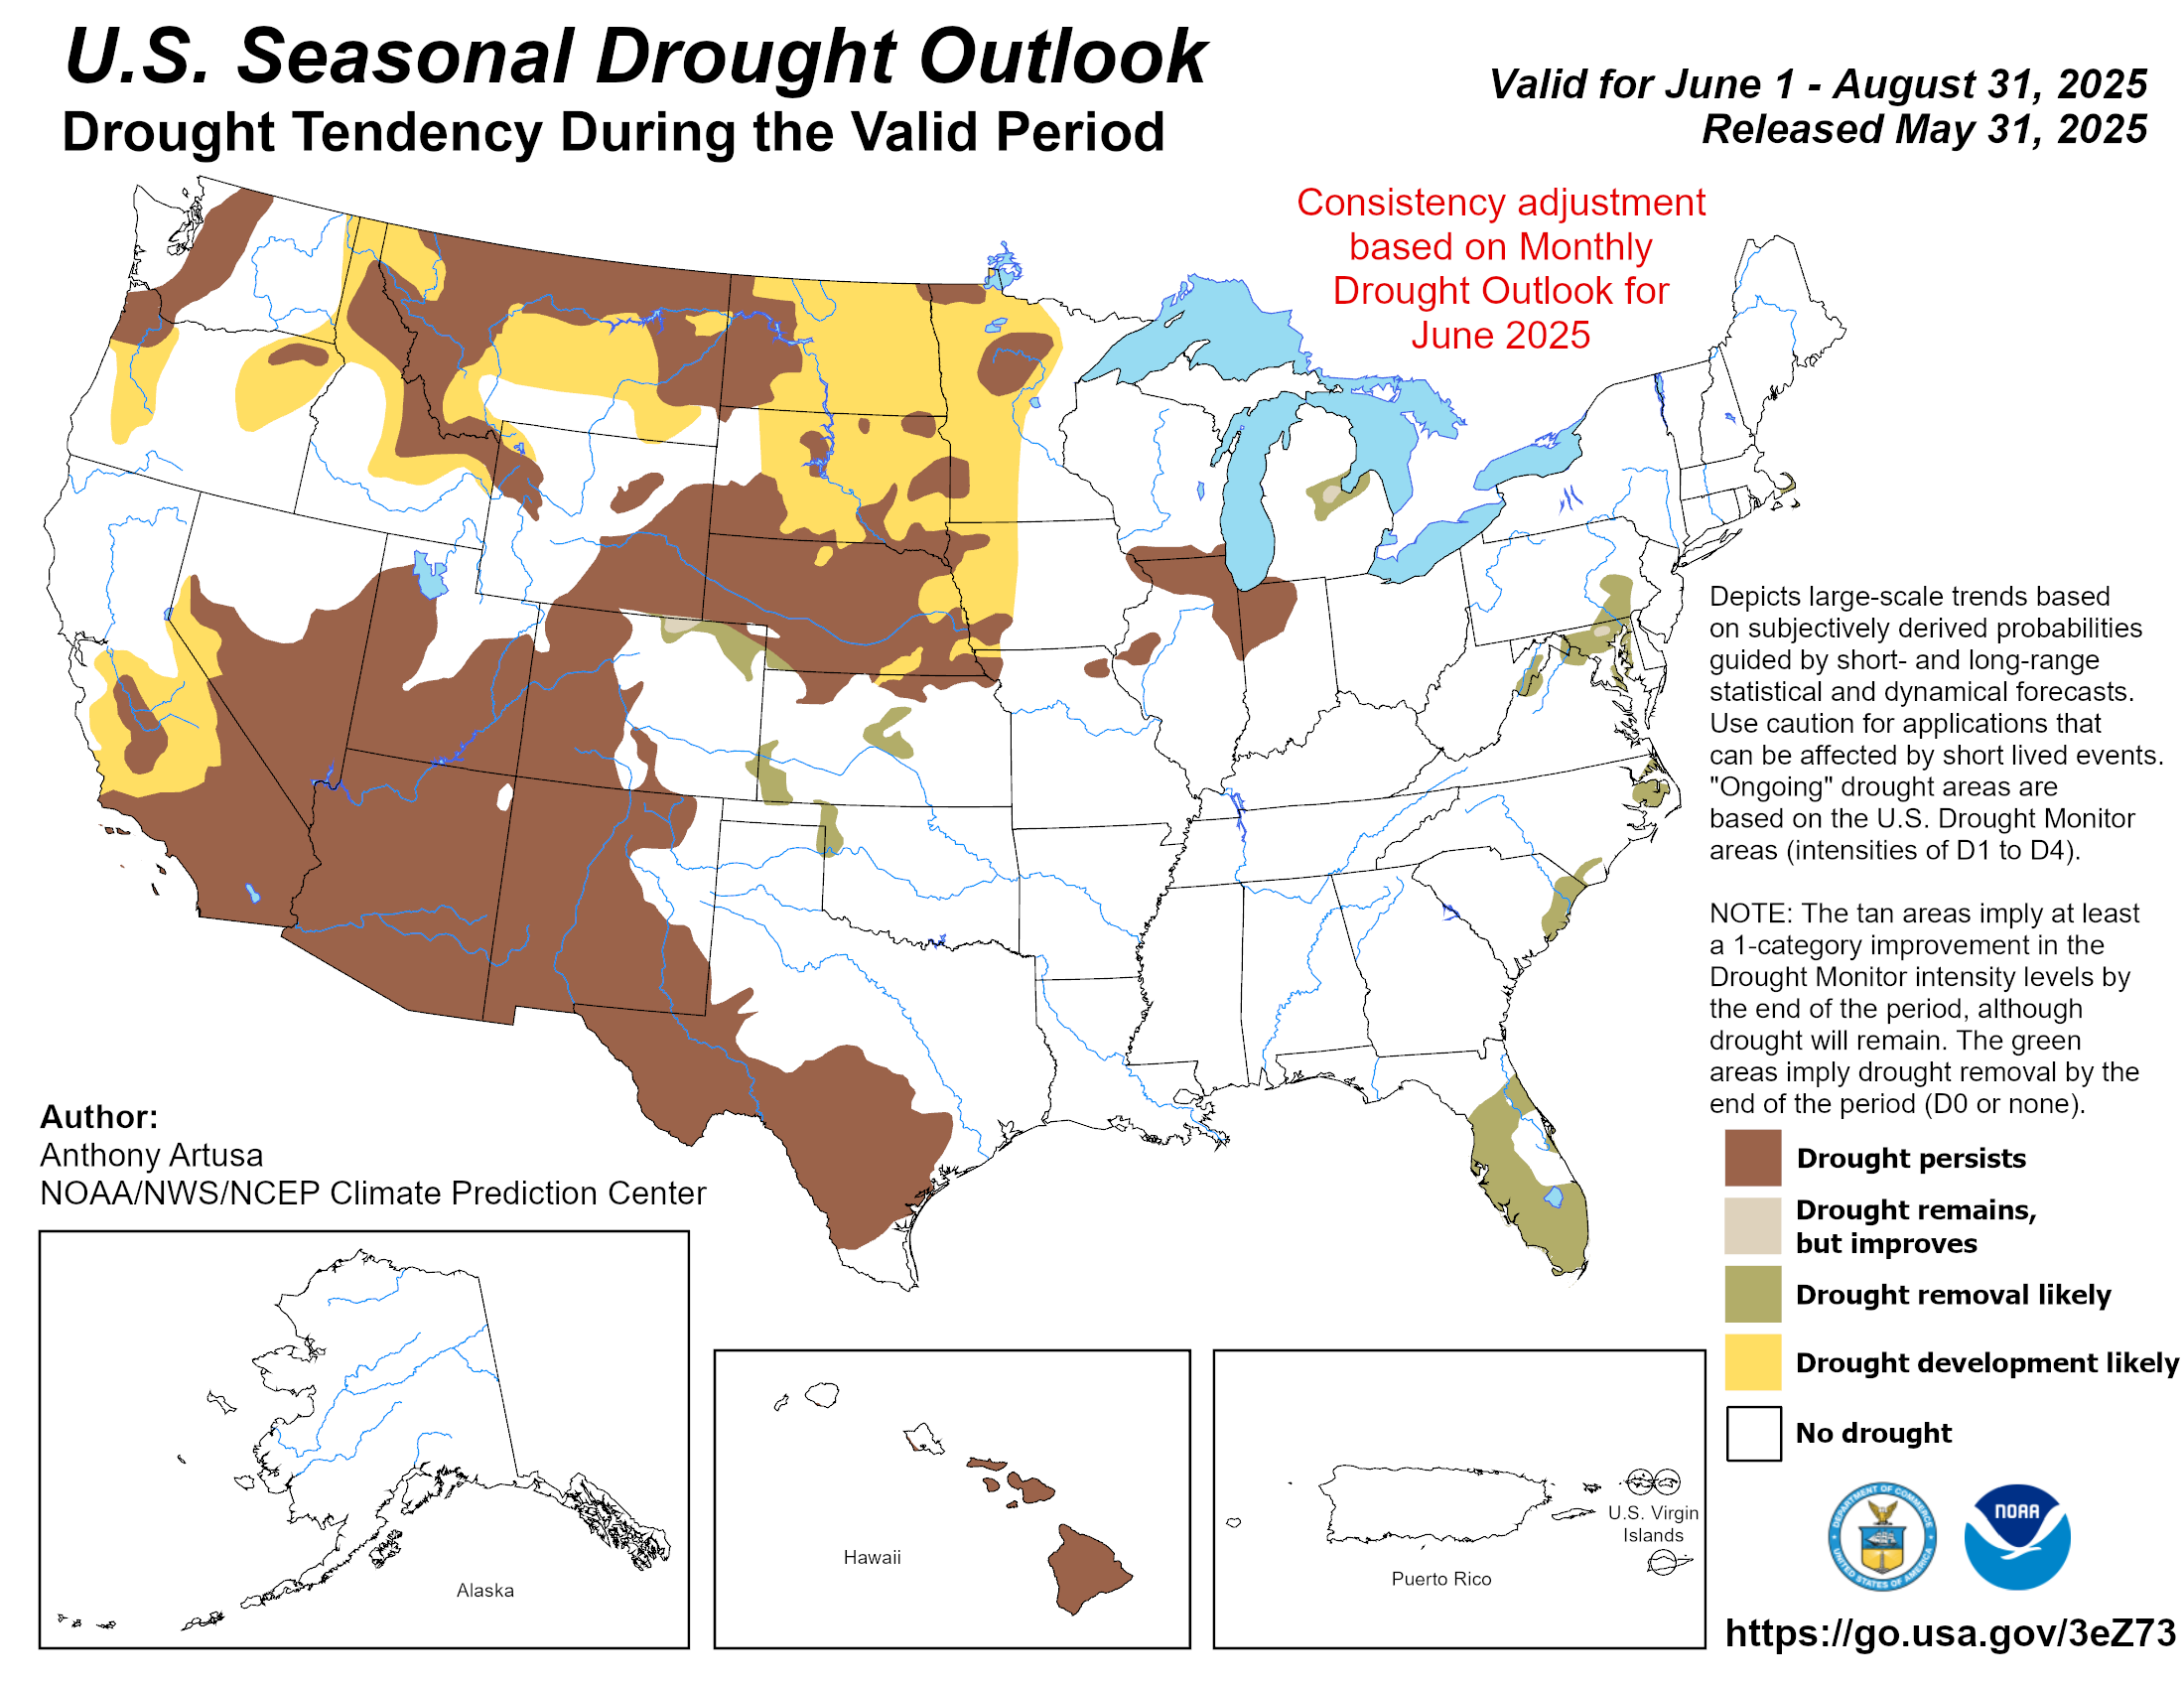
Seasonal Drought Outlook
Drought and snowpack are the same story out West. Where the season is starting from.
Seasonal Drought OutlookSource: NOAA CPC ↗
Map temporarily unavailable. View on NOAA
Where drought is forecast to develop, persist, or ease. A dry setup out West usually means the snowpack has ground to make up.
All maps are issued by NOAA (the Climate Prediction Center and the Weather Prediction Center; radar via the Iowa Environmental Mesonet) and update automatically here. Outlooks show probabilities, not guarantees: a "leaning wetter" signal tilts the odds, it does not promise snow on any given day. For the day-to-day forecast at your hill, head to any resort page.